
- Solve real problems with our hands-on interface
- Progress from basic puts and calls to advanced strategies
Interactive Options Course

Posted February 20, 2025 at 5:18 am
1/ Low Volatility!
2/ Rocks vs. Stocks
3/ Natural Gas Price Volatility
Investopedia is partnering with CMT Association on this newsletter. The contents of this newsletter are for informational and educational purposes only, however, and do not constitute investing advice. The guest authors, which may sell research to investors, and may trade or hold positions in securities mentioned herein do not represent the views of CMT Association or Investopedia. Please consult a financial advisor for investment recommendations and services.
Low Volatility!
The S&P 500 Low Volatility Index is designed to provide exposure to the 100 least volatile stocks within the S&P 500. It is equally-weighted and rebalances twice a year. Currently, the index is heavily weighted toward defensive Healthcare and Utilities sector stocks. The S&P 500 Low Volatility Index has historically realized less volatility and less severe drawdowns compared to the broad market.
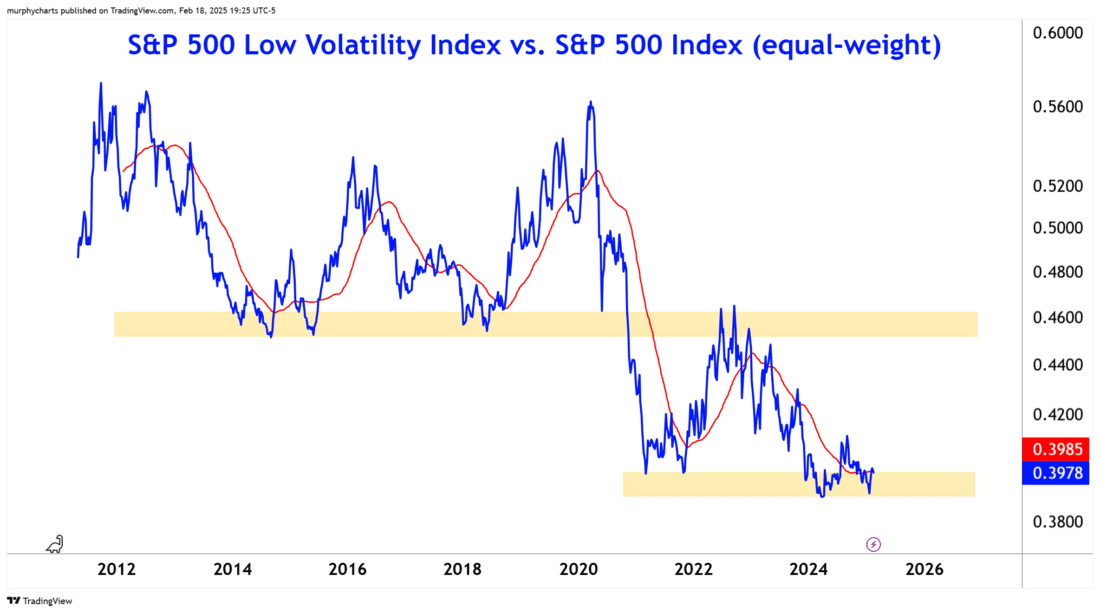
The above chart compares the price index to the equal-weight S&P 500 Index. The ratio is battling to stay above a rising 200-day moving average. If investors become more sensitive to earnings or price volatility, flows may be directed out of cyclical growth and into more stable defensive stocks. In that environment, we’d expect Low Volatility indices to shine.
Rocks vs. Stocks
On an absolute basis, the CRB Commodity Index is nearing its 2022 cycle highs. However relative to US Stocks, the asset class remains in a multi-year downtrend.
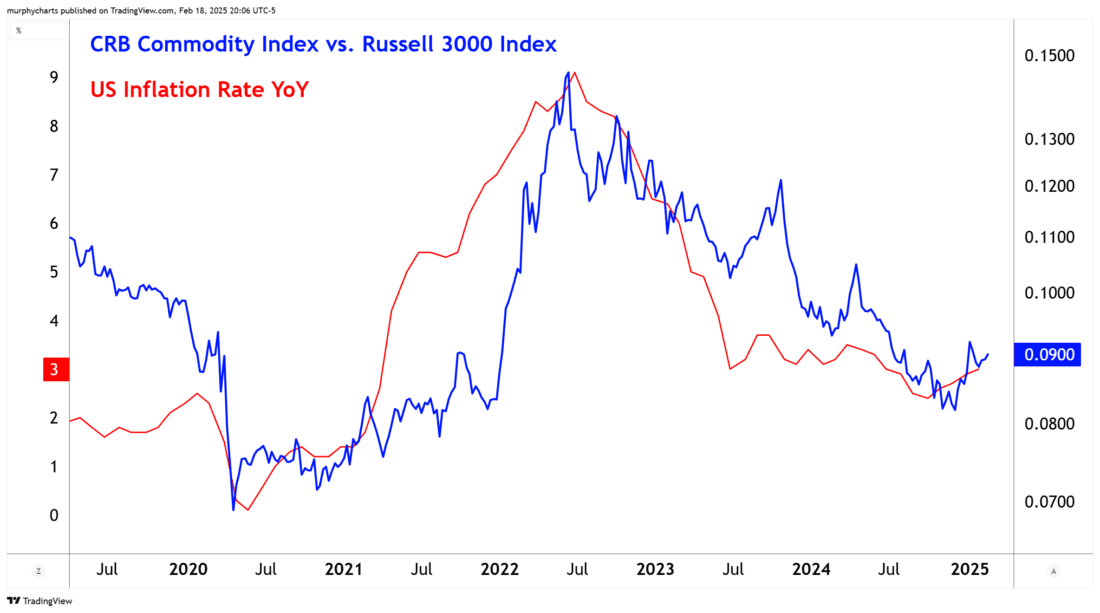
The ratio of Commodities vs. Stocks remains in a primary uptrend from the 2020 low – but finds itself in a secondary downtrend from the June 2022 high. For the time being, the trend is in favor of Commodities > Stocks.
Natural Gas Price Volatility
Speaking of commodities, this next chart highlights the recent volatility found in Natural Gas prices. Over the last 60-days, Natural Gas futures prices have moved ~$0.25 per day on average. That’s a big percentage swing for a contract priced at ~$4. With increased volatility, comes the increased likelihood for whipsaws to occur. This was certainly the case for Natural Gas e.g. many failed breakouts/breakdowns in recent years, making it a difficult environment for traditional trend followers.
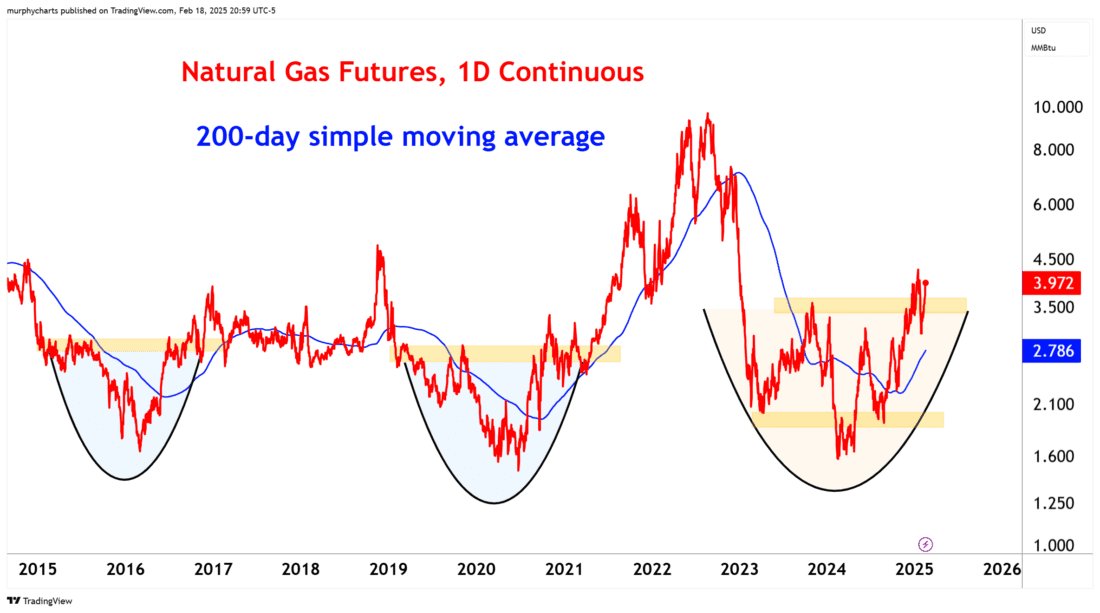
Despite the volatility, Natural gas finds itself trading above an upward sloping 200-day average and above the October 2023 price highs. The technical evidence is in favor of the bulls.
—
Originally posted 19th February 2025
Investopedia.com: The comments, opinions and analyses expressed herein are for informational purposes only and should not be considered individual investment advice or recommendations to invest in any security or to adopt any investment strategy. While we believe the information provided herein is reliable, we do not warrant its accuracy or completeness. The views and strategies described on our content may not be suitable for all investors. Because market and economic conditions are subject to rapid change, all comments, opinions and analyses contained within our content are rendered as of the date of the posting and may change without notice. The material is not intended as a complete analysis of every material fact regarding any country, region, market, industry, investment or strategy. This information is intended for US residents only.
Information posted on IBKR Campus that is provided by third-parties does NOT constitute a recommendation that you should contract for the services of that third party. Third-party participants who contribute to IBKR Campus are independent of Interactive Brokers and Interactive Brokers does not make any representations or warranties concerning the services offered, their past or future performance, or the accuracy of the information provided by the third party. Past performance is no guarantee of future results.
This material is from Investopedia and is being posted with its permission. The views expressed in this material are solely those of the author and/or Investopedia and Interactive Brokers is not endorsing or recommending any investment or trading discussed in the material. This material is not and should not be construed as an offer to buy or sell any security. It should not be construed as research or investment advice or a recommendation to buy, sell or hold any security or commodity. This material does not and is not intended to take into account the particular financial conditions, investment objectives or requirements of individual customers. Before acting on this material, you should consider whether it is suitable for your particular circumstances and, as necessary, seek professional advice.
Exchange Traded Commodities (ETCs) are only available from Interactive Brokers for IBKR LLC, IBKR Canada, IBKR Hong Kong and IBKR Singapore entities.
Related Articles


")
Join The Conversation
For specific platform feedback and suggestions, please submit it directly to our team using these instructions.
If you have an account-specific question or concern, please reach out to Client Services.
We encourage you to look through our FAQs before posting. Your question may already be covered!