
- Solve real problems with our hands-on interface
- Progress from basic puts and calls to advanced strategies
Interactive Options Course

Posted June 5, 2026 at 1:15 pm
A blockbuster nonfarm payrolls report is sending yields to the nosebleeds as Fed hike probabilities rise materially in response to persistently robust jobs numbers. It’s the third consecutive month with gains north of 170k, lifting odds of a 25-bp rate increase by year-end to approximately 70%, as the argument to cut or remain on hold in consideration of a softening labor market weakens significantly. The hawkish development is worsened by a Middle East conflict that has continued for over three months and is supporting elevated energy costs that have spread across the economy. And while the cyclical acceleration driven by the AI buildout has firms rushing to raise headcounts to scale operations, next week’s CPI, which is likely to have a 4 handle, is emblematic of the broad price pressure issues that could force new Chair Kevin Warsh’s hand. Indeed, the Treasury curve is climbing aggressively in bear-flattening fashion led by the monetary policy sensitive shorter tenors, which is strengthening the greenback as investors fret about the potential for a tighter central bank. Wall Street is turning defensive against this backdrop, with healthcare, staples, real estate and utilities advancing strongly during a session in which most major benchmarks retreat more than 1.5%. The Dow Jones is an exception. It even hit a fresh record subsequent to the opening bell before joining the other indices in the red. Elsewhere, a lack of speculative enthusiasm amidst increasingly restrictive financial conditions is battering cryptocurrency and commodities while traders look towards volatility protection instruments and prediction markets.
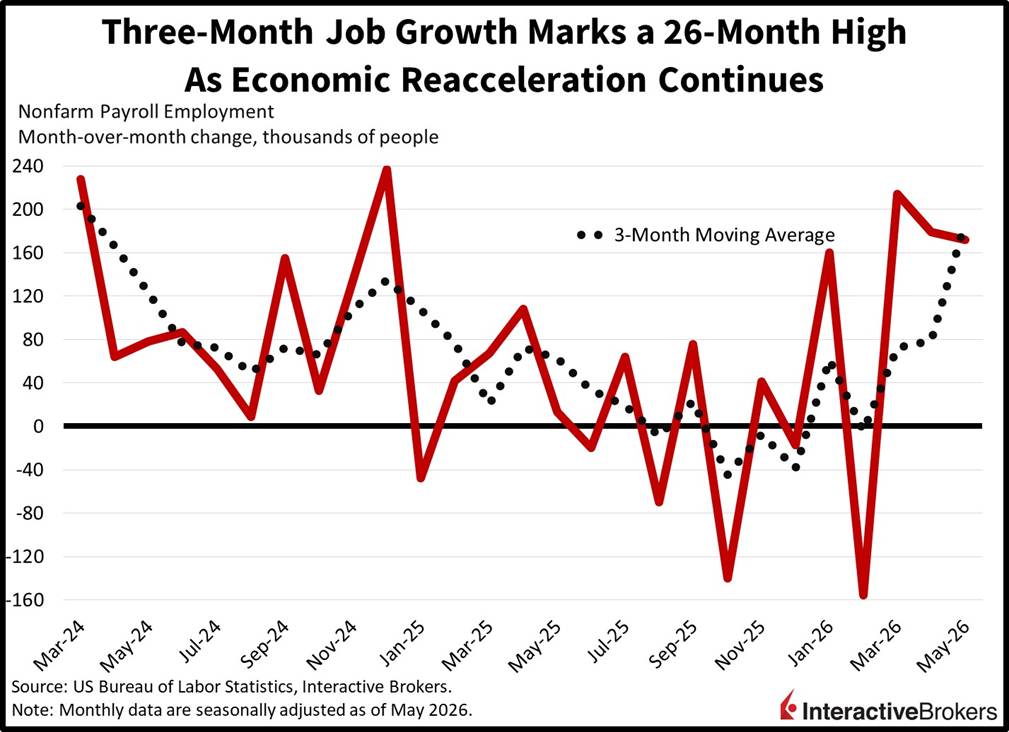
Today’s Jobs Friday Report posted a double beat as broad sectoral hiring strengthened confidence in the ongoing economic reacceleration. The 172k May expansion easily surpassed the 85k median estimate while slowing from the April and March upwardly revised gains of 179k and 214k. Industries with the strongest hiring and the number of recruited individuals were as follows:
In total, 10 of the 14 major segments lifted headcounts, although manufacturing, mining/logging, transportation/warehousing, utilities, professional/business services and other services added 7k or less. Conversely, financial activities, wholesale trade, information and retail shrank rosters by 22k, 4k, 2k and 1k.
The unemployment rate was steady at 4.3%, in-line with the consensus, while average hourly earnings increased 0.3% month over month (m/m) and 3.4% year over year (y/y), shifting in bifurcation fashion from 0.2% and 3.6% in the prior period. Furthermore, it’s not just a booming cycle that has firms sending employment offers—workers are getting cheaper relative to inflation, which is incentivizing businesses to expand personnel.
EV Demand Boosts Car Prices
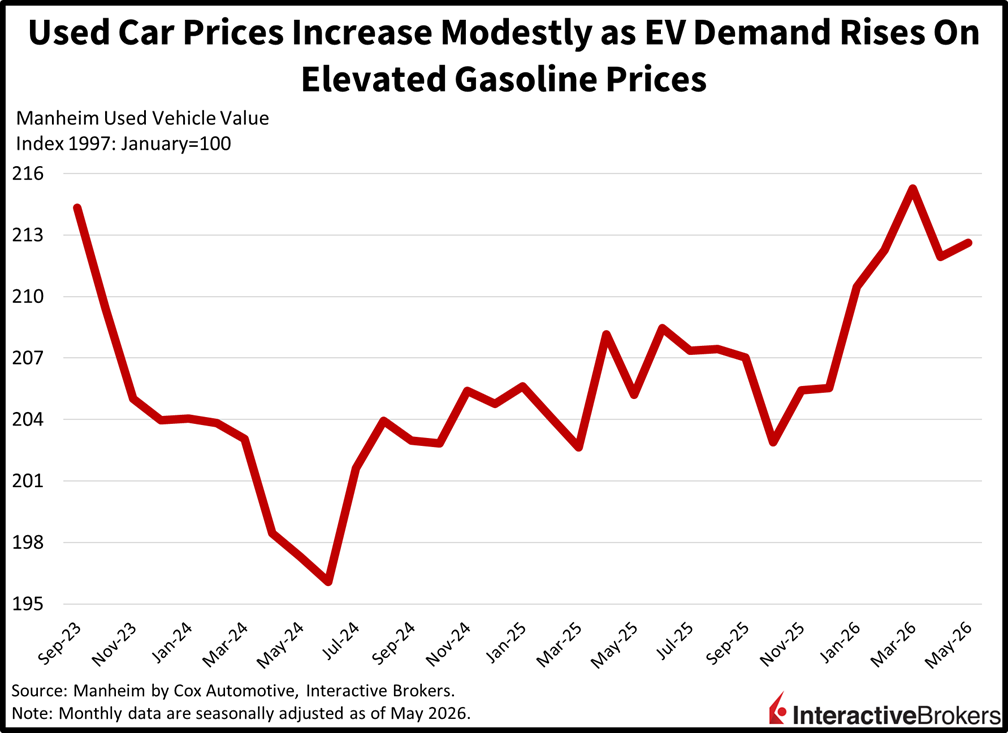
Pain at the pump continues to raise demand for electric automobiles (EVs) as used prices rose last month even as higher interest rates made monthly payments less manageable. Indeed, the Manheim Used Vehicle Index climbed 0.3% m/m and 3.6% year over year (y/y), which marks a significant acceleration from April’s -1.6% and 1.8%. Emblematic of the shifting preferences, non-EV costs were flat m/m and up 3% y/y while EVs rose 3.5% m/m and 11.9% y/y. Other fuel combustion energy categories including compact, luxury, midsize, pickups and SUVs charges rose 6.8%, 2.3%, 1.9%, 1.7% and 0.2% y/y.
With a plethora of headwinds facing equity markets, Wall Street could experience a volatile summer as investor fears grow ahead of Fed Chair Kevin Warsh’s first meeting at the helm and midterm elections this fall. And on the way there, there’s a long list of unresolved inflationary issues, including the Middle East conflict, a renewed tariff campaign and uncertainty about massive AI capital expenditures that together are contributing to a painful jump in interest rates. What’s most concerning about this climb, however, is its velocity and bumpiness, especially as recent increases in yields have maneuvered in a more orderly and tempered manner. With additional elevated price pressure reports due in a few days, we could very well see an extension of this brutal Treasury selloff, particularly if hurdles aren’t cleared up promptly. Fixed-income volatility can no longer be soothed with words. Rather, it needs progress on cost forces or on the federal deficit to provide imminent relief. Furthermore, a completed peace deal with Iran, including a reopening of the Strait of Hormuz, would likely spark recovery rallies in credit and equities alike, but a lingering total or even partial shutdown of the critical waterway won’t.
A 12% contraction in Ireland’s economy contributed to the euro area’s gross domestic product (GDP) falling 0.2% quarter over quarter (q/q) during the first three months of 2026. Nevertheless, the euro area economy was still up 0.3% from the year-ago period, according to Eurostat. The quarterly print missed the economist consensus expectation for GDP to repeat the preceding period’s 0.1% expansion. For the y/y result, economists anticipated a 0.8% growth rate following the fourth quarter’s 1.2% advance. Ireland’s GDP can be volatile, in large part due to the country’s number of multinational corporations. In the first quarter, exports and pharmaceutical stockpiling slowed, pulling down economic output. More broadly, international trade, which has been hindered by the Middle East crisis, was a significant headwind for the euro area with exports less imports producing a 0.3 percentage point q/q drag. Inventories and gross fixed capital formation were additional obstacles with each detracting 0.1 percentage points. The impact of those declines was only partially offset by household final consumption expenditures and government final consumption expenditures each contributing 0.1 percentage points to GDP.
The number of employed individuals in the euro area increased by 0.1% q/q and 0.5% y/y during the first quarter. Both metrics matched expectations but slowed from the q/q and y/y fourth quarter growth rates of 0.2% and 0.7%, according to Eurostat. Lithuania, Malta and Estonia recorded the highest increases in workers with additions of 1.8%, 1% and 0.9% of employed persons compared to the previous quarter. Conversely, Romania, Ireland and Portugal saw the largest declines with payrolls slipping 1%, 0.8% and 0.4%.
Canada’s unemployment rate fell from 6.9% in April to 6.6% last month, surprising economists who anticipated that the rate would remain unchanged. After a 17.7k decline in April, payrolls added 87.8k workers, according to Statistics Canada. The number of full-time workers climbed by 154k, a strong reversal from the 46.7k drop in April. Also last month, the number of part-time workers sank by 66.2k after the 29k April addition. Wage growth, however, slowed from 4.8% y/y in April to 3.2%.
After high fuel costs contributed to Singapore retail sales jumping 3.4% m/m in March, consumer spending grew only 0.3% last month. Cashier transactions, nevertheless, still exceeded the year-ago level by 5.4%. In March, sales were up 4.6% y/y. Within the m/m print, sales growth at petrol services station eased from 16.2% to 7%. Sales growth at mini-marts and specialty stores also slowed, moving from 12.5% to 2.5%. In other areas, outlays for food and alcohol climbed 7.1% following a 5.3% decline in March. Spending on computer and telecommunications equipment and the category consisting of watches and jewelry, furthermore, reversed from 8.1 and 8.5% growth to 5.1% and 2.6% declines.
Household spending ascended by 1.6% m/m in April, a stronger result than the economist consensus estimate for a 0.8% jump and a much better showing than the preceding month’s 1.3% drop. Spending was still down 0.5% compared to the year-ago period, but it was better than both the economist consensus estimate for a 1.5% contraction and the 2.9% March dip. Also in April, wages climbed 3.5% y/y, surpassing the economist estimate for a repeat of the 3.1% March ascent.
New to Interactive Brokers?
Open AccountInformation posted on IBKR Campus that is provided by third-parties does NOT constitute a recommendation that you should contract for the services of that third party. Third-party participants who contribute to IBKR Campus are independent of Interactive Brokers and Interactive Brokers does not make any representations or warranties concerning the services offered, their past or future performance, or the accuracy of the information provided by the third party. Past performance is no guarantee of future results.
This material is from IBKR Macroeconomics, an affiliate of Interactive Brokers LLC, and is being posted with its permission. The views expressed in this material are solely those of the author and/or IBKR Macroeconomics and Interactive Brokers is not endorsing or recommending any investment or trading discussed in the material. This material is not and should not be construed as an offer to buy or sell any security. It should not be construed as research or investment advice or a recommendation to buy, sell or hold any security or commodity. This material does not and is not intended to take into account the particular financial conditions, investment objectives or requirements of individual customers. Before acting on this material, you should consider whether it is suitable for your particular circumstances and, as necessary, seek professional advice.
Trading in digital assets, including cryptocurrencies, is especially risky and is only for individuals with a high risk tolerance and the financial ability to sustain losses. Eligibility to trade in digital asset products may vary based on jurisdiction.
Futures, event contracts, and forecast contracts are not suitable for all investors. Before trading these products, please read the CFTC Risk Disclosure. For a copy, visit our Warnings and Disclosures Page.
For specific platform feedback and suggestions, please submit it directly to our team using these instructions.
If you have an account-specific question or concern, please reach out to Client Services.
We encourage you to look through our FAQs before posting. Your question may already be covered!
Related Articles


Recovering your lost investment funds as the case might be, is not what you can do alone, you’d require the service of a trained recovery specialist. A recovery specialist is a person or a group of people who are well equipped to work around the brokerage network. They have vast knowledge about the whole network and have the right software and private keys to follow any transaction. I was ripped off trading online to an investment broker, good thing I got every penny back through the help of Gavin ray he’s a genius Contact : Gavinray78 at gmail com It is also important to be patient and really calm during the process.