
- Solve real problems with our hands-on interface
- Progress from basic puts and calls to advanced strategies
Interactive Options Course

Posted May 23, 2025 at 9:28 am
1/ Something to Avoid
2/ Something to Watch
3/ Something Good
Investopedia is partnering with CMT Association on this newsletter. The contents of this newsletter are for informational and educational purposes only, however, and do not constitute investing advice. The guest authors, which may sell research to investors, and may trade or hold positions in securities mentioned herein do not represent the views of CMT Association or Investopedia. Please consult a financial advisor for investment recommendations and services.
Something to Avoid
In my final issue of Investopedia’s “Chart Advisor” this time around, I’d like to wrap things up with:
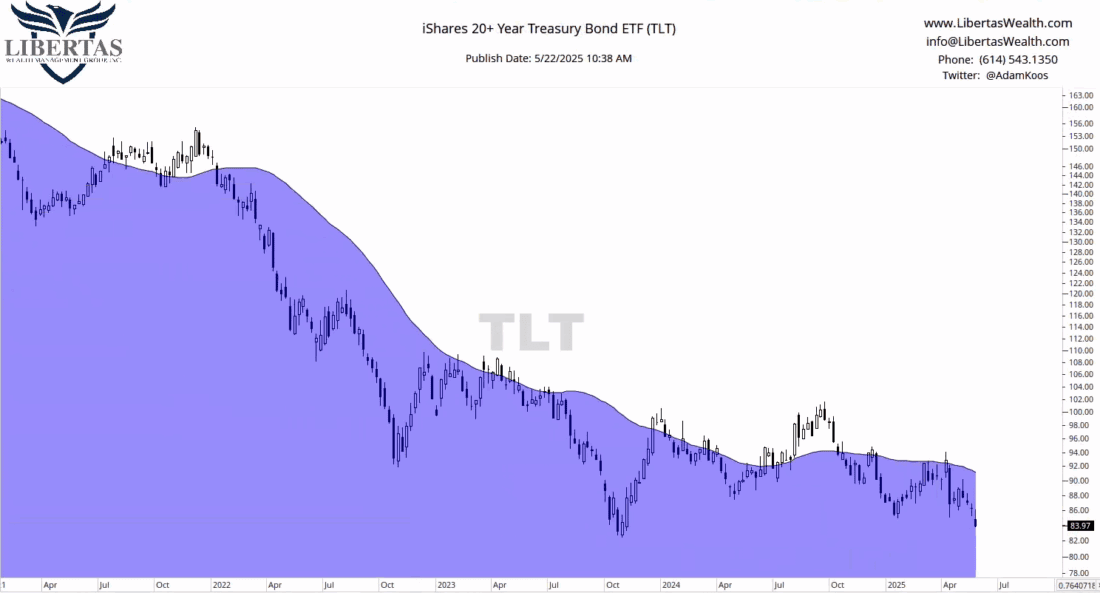
Let’s go backwards and start with long-term treasury bonds…
I showed this chart to my 11-year old son and asked him if he thought it was in a downtrend or an uptrend. He answered correctly, “Uptrend… obviously!” <laughter>
I then asked him, if he’d invest the money he has in his savings account into this investment, and he responded, “You always say to only buy investments that are in uptrends, right?”
He gets it…
The only way I’d even consider touching long-term Treasuries would be if I put on a small position here and placed a hard-stop at the fall ’23 lows, but that’s it… and there are so, so many other, better investments to consider than what you’re looking at below.
Something to Watch
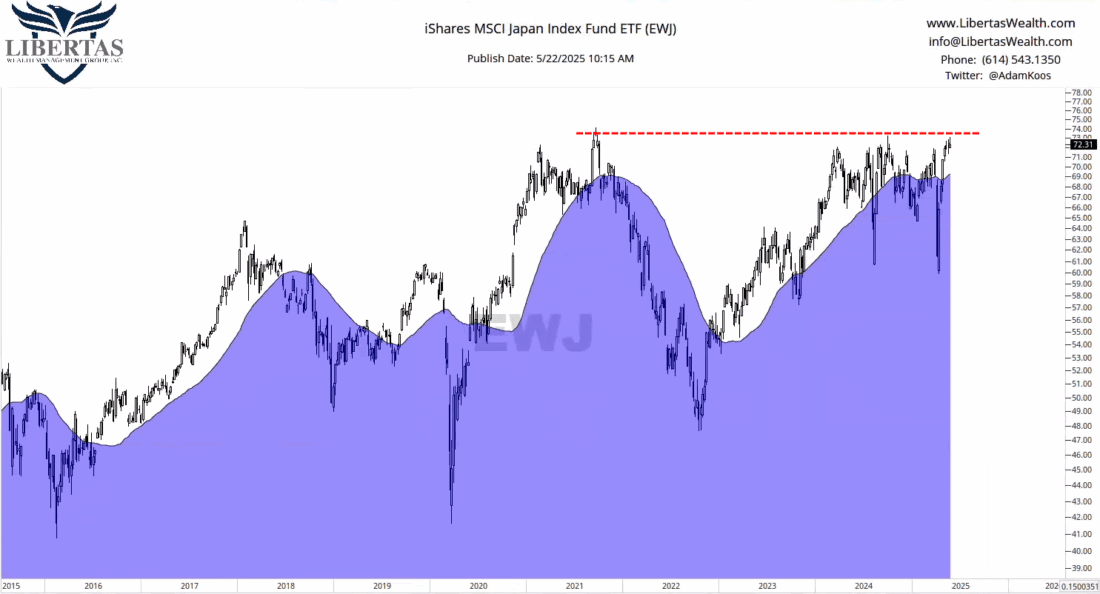
Japan has been choppy, but after a steep decline between 2021-22, it’s made a comeback and is now contesting all-time-highs – a level that’s been touched two times before since 2021.
I’m not interested until this thing proves itself, and I’d also be looking at the relative strength comparison between international and domestic stocks, as well as the relatives between Japan and the S&P500…
…but if this breaks out, there would be a pretty defined line-in-the-sand from a risk management standpoint.
Something Good
Last, but certainly not least, here’s a good chart I’m definitely interested in…
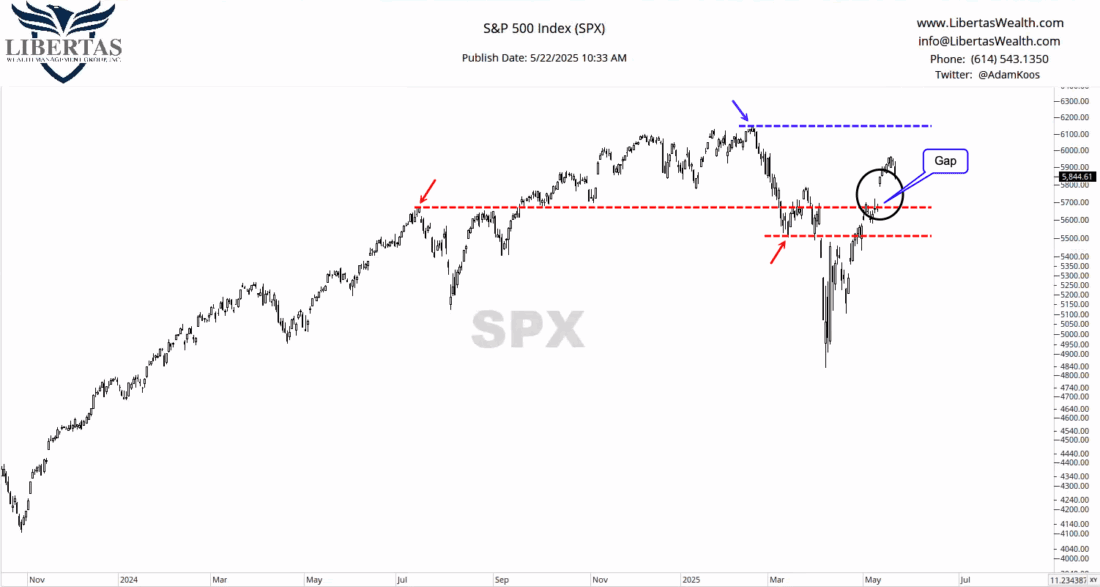
While we’re looking at the S&P500 here, we could also be looking at the DJIA or the Nasdaq Composite. Bottom line, while the short-term relative strength is in favor of international stocks, the intermediate and long-term picture still favors the U.S. over its international counterparts.
With all that being said, it’s important to understand the levels of importance here…
First, of course, is the all-time-highs (in blue). If we break out, then we’re in the green.
Secondly, the bottom edge of the gap-up, which also corresponds with the summer ’24 highs. If the market can hold above this level, even after closing the gap, I think it’s in pretty good shape.
Lastly, the March ’25 lows – below this level, I have a hard time calling this an uptrend… or even “trendless” anymore, so look out below.
With those levels defined, I think it’s pretty simple (although not “easy”) to know how much risk to take as the weeks and months move along.
—
Originally posted 23rd May 2025
Investopedia.com: The comments, opinions and analyses expressed herein are for informational purposes only and should not be considered individual investment advice or recommendations to invest in any security or to adopt any investment strategy. While we believe the information provided herein is reliable, we do not warrant its accuracy or completeness. The views and strategies described on our content may not be suitable for all investors. Because market and economic conditions are subject to rapid change, all comments, opinions and analyses contained within our content are rendered as of the date of the posting and may change without notice. The material is not intended as a complete analysis of every material fact regarding any country, region, market, industry, investment or strategy. This information is intended for US residents only.
Information posted on IBKR Campus that is provided by third-parties does NOT constitute a recommendation that you should contract for the services of that third party. Third-party participants who contribute to IBKR Campus are independent of Interactive Brokers and Interactive Brokers does not make any representations or warranties concerning the services offered, their past or future performance, or the accuracy of the information provided by the third party. Past performance is no guarantee of future results.
This material is from Investopedia and is being posted with its permission. The views expressed in this material are solely those of the author and/or Investopedia and Interactive Brokers is not endorsing or recommending any investment or trading discussed in the material. This material is not and should not be construed as an offer to buy or sell any security. It should not be construed as research or investment advice or a recommendation to buy, sell or hold any security or commodity. This material does not and is not intended to take into account the particular financial conditions, investment objectives or requirements of individual customers. Before acting on this material, you should consider whether it is suitable for your particular circumstances and, as necessary, seek professional advice.
Any discussion or mention of an ETF is not to be construed as recommendation, promotion or solicitation. All investors should review and consider associated investment risks, charges and expenses of the investment company or fund prior to investing. Before acting on this material, you should consider whether it is suitable for your particular circumstances and, as necessary, seek professional advice.
Municipal Bonds are only available from Interactive Brokers for IBKR LLC, IBKR Canada, IBKR Hong Kong, IBKR Australia and IBKR Singapore entities.
Related Articles


Join The Conversation
For specific platform feedback and suggestions, please submit it directly to our team using these instructions.
If you have an account-specific question or concern, please reach out to Client Services.
We encourage you to look through our FAQs before posting. Your question may already be covered!