
- Solve real problems with our hands-on interface
- Progress from basic puts and calls to advanced strategies
Interactive Options Course
Latest Webinars
Posted July 29, 2025 at 9:16 am
1/ Offense Over Defense Says “Risk On” For Stocks
2/ One Specialty Retailer Baking Up New Three-Month Highs
3/ New Dow Theory Flashes “Bull Confirmed” Signal
Investopedia is partnering with CMT Association on this newsletter. The contents of this newsletter are for informational and educational purposes only, however, and do not constitute investing advice. The guest authors, which may sell research to investors, and may trade or hold positions in securities mentioned herein do not represent the views of CMT Association or Investopedia. Please consult a financial advisor for investment recommendations and services.
Offense Over Defense Says “Risk On” For Stocks
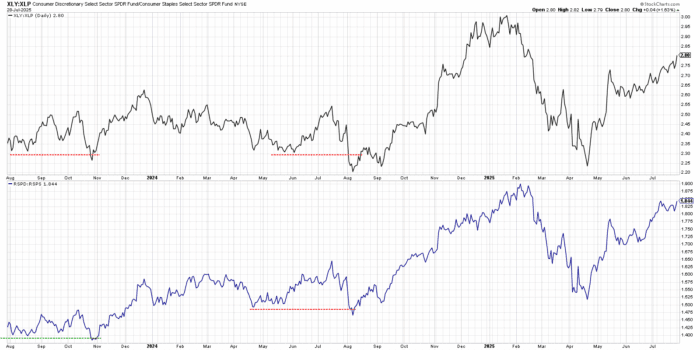
Legendary technical analyst Bill Doane, who ran the technical research team at Fidelity in the 1970s, explained that they saw one of their chief goals as to determine whether the “offense” or “defense” was in control of the market. My favorite ratio to track this relationship is very much favoring offense going into August.

The top panel tracks a simple ratio of the Consumer Discretionary Select Sector SPDR Fund (XLY) and the Consumer Staples Select Sector SPDR Fund (XLP). The bottom panel uses equal-weighted ETFs tracking those same two sectors. By tracking the movements in these two ratios, we can determine whether investors are rotating more to “things you want” or “things you need.”
With both ratios making new three-month highs in July, this confirms that investors are favoring “things you want” and suggests strong optimism for stocks. If and when that ratio starts to turn lower, perhaps during the seasonally weaker months of August and September, that would mean more defensive positioning for investors and a more cautious conclusion for this basic gauge of investor sentiment.
One Specialty Retailer Baking Up New Three-Month Highs
Let’s look at two stocks from the Consumer Discretionary sector that feature constructive chart patterns in recent weeks. First, we’ll review the chart of Williams Sonoma Inc. (WSM).

Last week, WSM popped above resistance around $180, taking the stock above the price peak from early May. This move to a new swing high came after WSM had found support at a cluster of moving averages, forming another higher low since the April market bottom.
At the June and July swing lows, the Relative Strength Index (RSI) remained above the crucial 40 level. Using the “range rules” approach with RSI, as popularized by legendary technical analyst Connie Brown, we can confirm a bullish phase for WSM. As long as the RSI holds that 40 level on subsequent pullbacks, we’ll remain optimistic that this consumer name could retest its January all-time high.
Break Above the 200-Day? Just Do it.
Shares of Nike Inc. (NKE) have experienced a similar pattern of a breakout and then pullback, but in this case, the 200-day moving average has played a key part in the analysis. With a move back above the 200-day moving average, and improving trend characteristics, we see NKE as having rotated from a bearish to bullish phase.
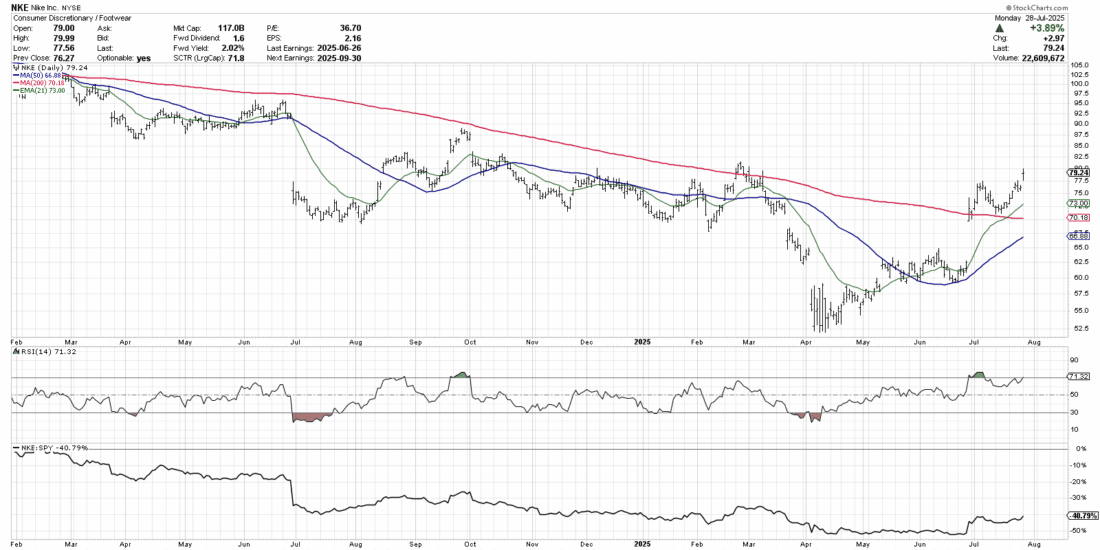
Going into the April low, NKE was showing all the classic signs of distribution. Price was making lower lows and lower highs, the moving averages were all sloping downwards, and the RSI was consistently in the bearish range below 60. After an initial rally into May, Nike eventually pushed back above the 21-day exponential moving average and 50-day simple moving average.
After its June 26th earnings release, NKE finally popped back above the 200-day moving average, followed by a classic pullback to retest moving average support. With the stock back above the 200-day moving average, and the RSI back into the bullish range, we’re seeing a confirmed uptrend phase until proven otherwise.
With this particular setup, the 21-day exponential moving average can often serve as an initial warning sign of an exhaustion of buyers. But until we see a valid breakdown below this short-term trend gauge, we’re expecting further upside for this thriving footwear stock.
—
Originally posted 29th July 2025
Investopedia.com: The comments, opinions and analyses expressed herein are for informational purposes only and should not be considered individual investment advice or recommendations to invest in any security or to adopt any investment strategy. While we believe the information provided herein is reliable, we do not warrant its accuracy or completeness. The views and strategies described on our content may not be suitable for all investors. Because market and economic conditions are subject to rapid change, all comments, opinions and analyses contained within our content are rendered as of the date of the posting and may change without notice. The material is not intended as a complete analysis of every material fact regarding any country, region, market, industry, investment or strategy. This information is intended for US residents only.
Information posted on IBKR Campus that is provided by third-parties does NOT constitute a recommendation that you should contract for the services of that third party. Third-party participants who contribute to IBKR Campus are independent of Interactive Brokers and Interactive Brokers does not make any representations or warranties concerning the services offered, their past or future performance, or the accuracy of the information provided by the third party. Past performance is no guarantee of future results.
This material is from Investopedia and is being posted with its permission. The views expressed in this material are solely those of the author and/or Investopedia and Interactive Brokers is not endorsing or recommending any investment or trading discussed in the material. This material is not and should not be construed as an offer to buy or sell any security. It should not be construed as research or investment advice or a recommendation to buy, sell or hold any security or commodity. This material does not and is not intended to take into account the particular financial conditions, investment objectives or requirements of individual customers. Before acting on this material, you should consider whether it is suitable for your particular circumstances and, as necessary, seek professional advice.
Any discussion or mention of an ETF is not to be construed as recommendation, promotion or solicitation. All investors should review and consider associated investment risks, charges and expenses of the investment company or fund prior to investing. Before acting on this material, you should consider whether it is suitable for your particular circumstances and, as necessary, seek professional advice.


Join The Conversation
For specific platform feedback and suggestions, please submit it directly to our team using these instructions.
If you have an account-specific question or concern, please reach out to Client Services.
We encourage you to look through our FAQs before posting. Your question may already be covered!