
- Solve real problems with our hands-on interface
- Progress from basic puts and calls to advanced strategies
Interactive Options Course
Posted March 5, 2025 at 10:47 am
From SIA Charts
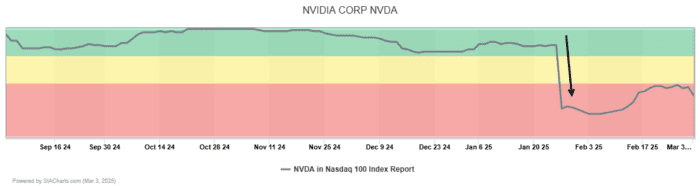
1/ Nvidia Corp. (NVDA)
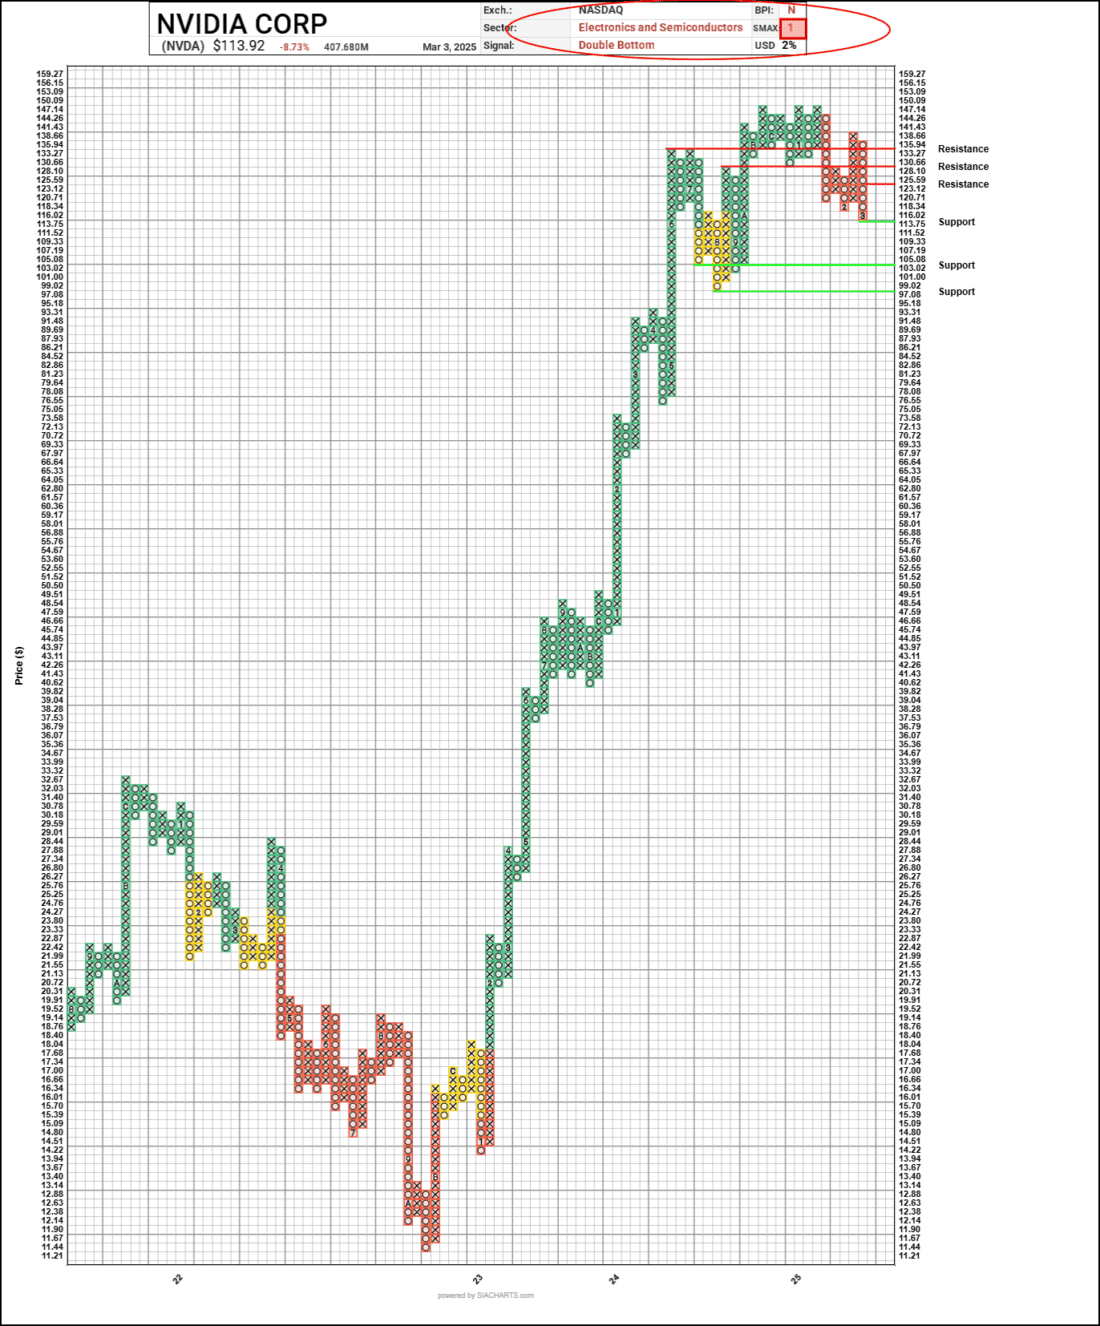
2/ Point and Figure Chart
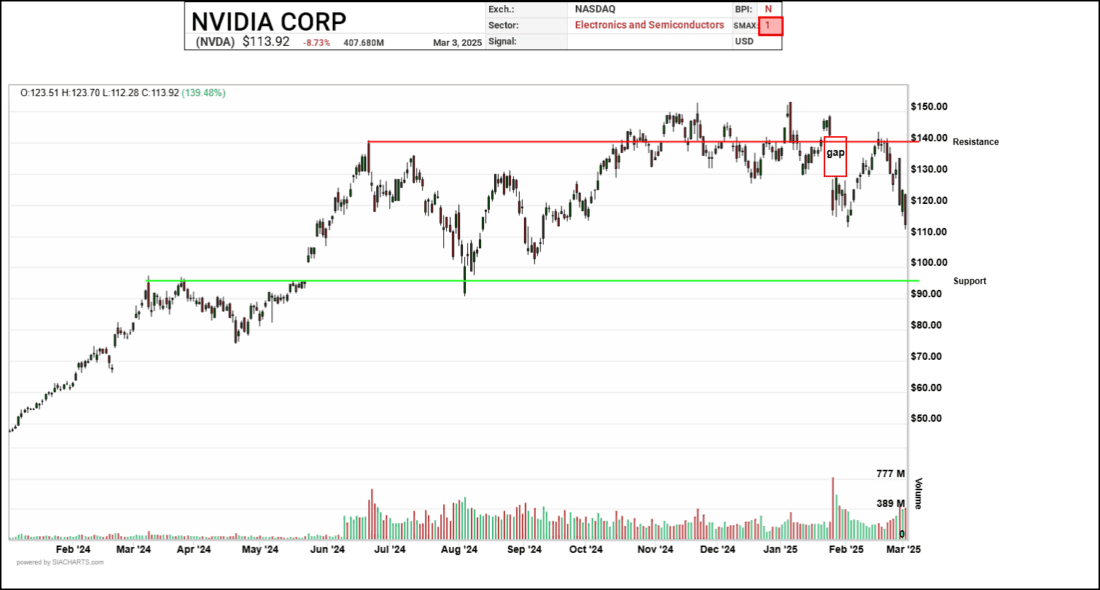
3/ Candlestick Chart
Investopedia is partnering with CMT Association on this newsletter. The contents of this newsletter are for informational and educational purposes only, however, and do not constitute investing advice. The guest authors, which may sell research to investors, and may trade or hold positions in securities mentioned herein do not represent the views of CMT Association or Investopedia. Please consult a financial advisor for investment recommendations and services.
Nvidia Corp. (NVDA)
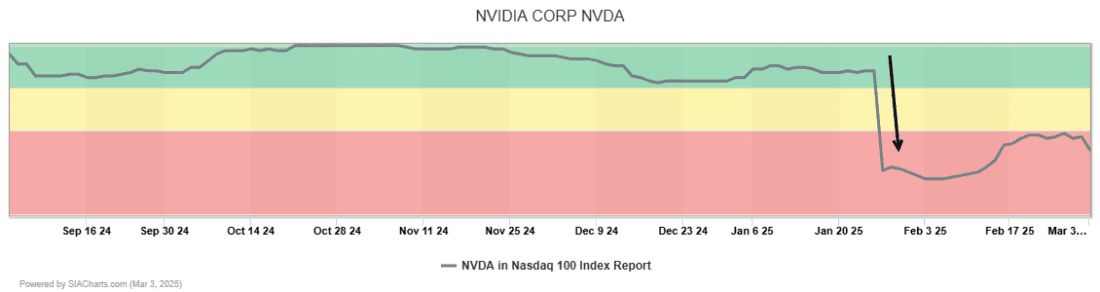
Having technically analyzed Broadcom Inc. in yesterday’s Daily Stock Report, we thought we would take a moment to review the charts of another widely held stock today that needs no introduction. NVDA was the big winner in 2024 but has been sputtering out of the gate for 2025, as both the shares have turned decidedly negative on its SIA relative strength rank, along with the sector, which has also slipped negative on its relative strength rankings within the SIA Market Sector report. This slippage of relative strength is easily seen on the SIA matrix position chart attached, which shows NVDA shares moving through the yellow neutral zone of the report into the red unfavored zone, putting SIA practitioners on alert.
Point and Figure Chart
The point and figure chart attached with the matrix position overlay tool engaged further illustrates this pullback in relative strength, even as the shares held the support line over the past quarter with relatively little damage done to the chart. But SIA’s main coach relative strength may be painting a different picture than the actual chart itself, as sellers appear to be gaining more and more control of trading, with shares slipping on consecutive double bottom point and figure sell signals. Here on the PNF chart, we find some support at current levels, but the main body of support may still be about 10%-15% below current levels at $103.02 and $97.08, while resistance is highlighted on the chart at $125.59, $130.66, and $135.94, with the top line $150 still in place as the old high.
Candlestick Chart
Turning to a short-term daily candlestick chart, we can see that after reaching a high of $150 in late 2025, shares of NVDA gapped down on the Deep Seek news that suggested they had more efficient systems, which could take the wind from the back of NVIDIA’s command of the space. This gap was subsequently filled, as oddly is often the case, but shares then sold off once more even on outperforming earnings numbers last week. Since then, sellers appear in command of the shares, with fast-moving selloffs coupled with some recovery in a 3 steps back, 2 steps forward type of way. Here on the daily candlestick chart, support is observable just below the $100 mark, while resistance is highlighted at the $140 mark, which may mark a new trading range for NVDA shares until more information in the global AI race for supremacy is revealed.
—
Originally posted 5th March 2025
Investopedia.com: The comments, opinions and analyses expressed herein are for informational purposes only and should not be considered individual investment advice or recommendations to invest in any security or to adopt any investment strategy. While we believe the information provided herein is reliable, we do not warrant its accuracy or completeness. The views and strategies described on our content may not be suitable for all investors. Because market and economic conditions are subject to rapid change, all comments, opinions and analyses contained within our content are rendered as of the date of the posting and may change without notice. The material is not intended as a complete analysis of every material fact regarding any country, region, market, industry, investment or strategy. This information is intended for US residents only.
Information posted on IBKR Campus that is provided by third-parties does NOT constitute a recommendation that you should contract for the services of that third party. Third-party participants who contribute to IBKR Campus are independent of Interactive Brokers and Interactive Brokers does not make any representations or warranties concerning the services offered, their past or future performance, or the accuracy of the information provided by the third party. Past performance is no guarantee of future results.
This material is from Investopedia and is being posted with its permission. The views expressed in this material are solely those of the author and/or Investopedia and Interactive Brokers is not endorsing or recommending any investment or trading discussed in the material. This material is not and should not be construed as an offer to buy or sell any security. It should not be construed as research or investment advice or a recommendation to buy, sell or hold any security or commodity. This material does not and is not intended to take into account the particular financial conditions, investment objectives or requirements of individual customers. Before acting on this material, you should consider whether it is suitable for your particular circumstances and, as necessary, seek professional advice.
Related Articles


 the Small-Cap Breakout")

Join The Conversation
For specific platform feedback and suggestions, please submit it directly to our team using these instructions.
If you have an account-specific question or concern, please reach out to Client Services.
We encourage you to look through our FAQs before posting. Your question may already be covered!