
- Solve real problems with our hands-on interface
- Progress from basic puts and calls to advanced strategies
Interactive Options Course
Posted January 15, 2026 at 10:29 am
1/ Defense Over Offense Suggests Further Rotation
2/ Microsoft Breaks Below Key Fibonacci Support
3/ Bearish Divergence Hints at Top for Delta Air Lines
Investopedia is partnering with CMT Association on this newsletter. The contents of this newsletter are for informational and educational purposes only, however, and do not constitute investing advice. The guest authors, which may sell research to investors, and may trade or hold positions in securities mentioned herein do not represent the views of CMT Association or Investopedia. Please consult a financial advisor for investment recommendations and services.
Defense Over Offense Suggests Further Rotation
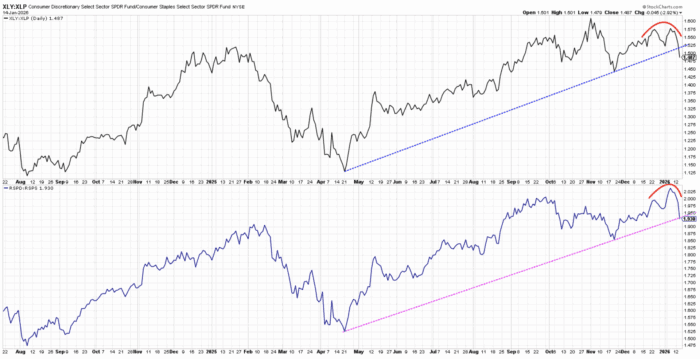
By tracking a ratio of the Consumer Discretionary to Consumer Staples sectors, we can gauge whether investors are leaning into “things you want” over “things you need.” Consumers will tend to spend on discretionary purchases during bullish environments, yet they will often hold off when economic conditions are less favorable. But since consumers tend to always spend money on “necessities” like cleaning products, personal care goods, and beverages, the Consumer Staples sector is more immune to economic shifts.
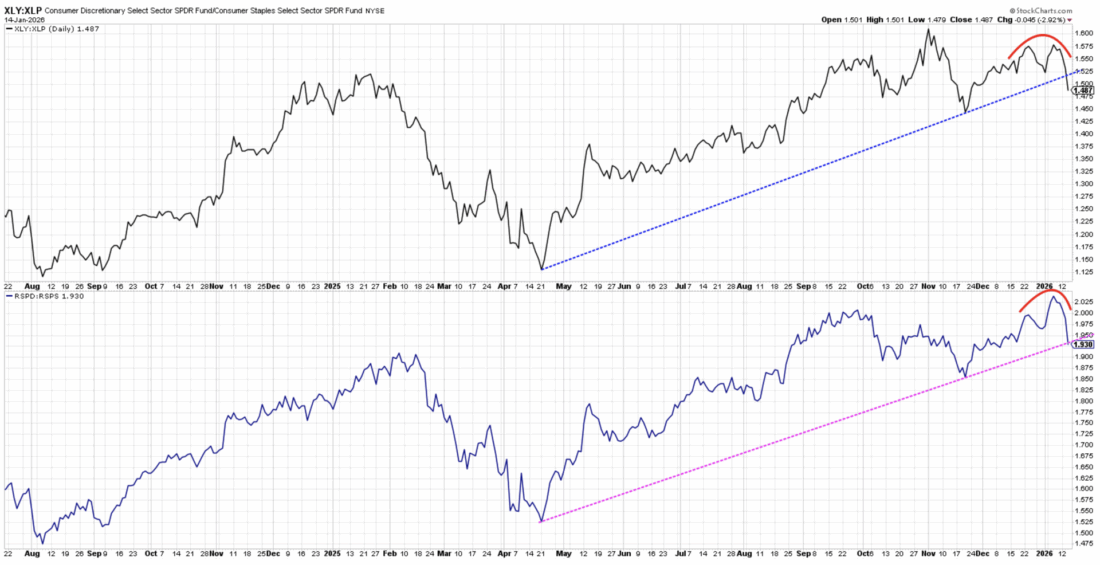
The top panel shows this “offense to defense” ratio using the traditional market cap-weighted ETFs, while the bottom panel features the equal-weighted ETFs for the two consumer sectors. While both ratios trended higher off the April 2025 market low, and the cap-weighted ratio continued higher into a late October peak, the equal-weighted version topped out in late September.
Both ratios have turned lower this week, signaling a failed breakout above their 2025 tops. This recent pullback has now brought the long-term uptrend thesis into question, as both ratios are struggling to hold trendline support based on the April and November lows. If these ratios continue lower into late January, that could indicate a defensive rotation and suggest caution for investors going into February.
Microsoft Breaks Below Key Fibonacci Support
Even though a number of technology stocks remain near all-time highs, we’ve observed a continued rotation from growth into value. We’ve even noted dispersion within the Magnificent 7 stocks, with the strength in charts like Alphabet (GOOGL) providing an excellent counterpoint to the weakness in names like Microsoft (MSFT).

Microsoft’s October peak ended up creating a clear double top pattern for the technology leader, followed soon after by a pullback to the 200-day moving average. Using the April low and July high as a framework, we can see that the drop to the 200-day moving average in November also lined up with the 38.2% retracement level.
After bouncing off this “confluence of support” in December, Microsoft appears to have finally broken down to a new swing low this week. After Tuesday’s initial break of support, the further down move on Wednesday served as a downside follow-through day which implies the downturn has not reached a climax. A 61.8% retracement would mean a move down to around $425, representing a 24% loss from the July 2025 all-time high.
Bearish Divergence Hints at Top for Delta Air Lines
After Delta Air Lines (DAL) reported earnings on Tuesday, the stock broke below the 21-day exponential moving average. But before the airline dropped down through this initial stop loss level, a bearish momentum divergence served as an early warning of a potential downturn.
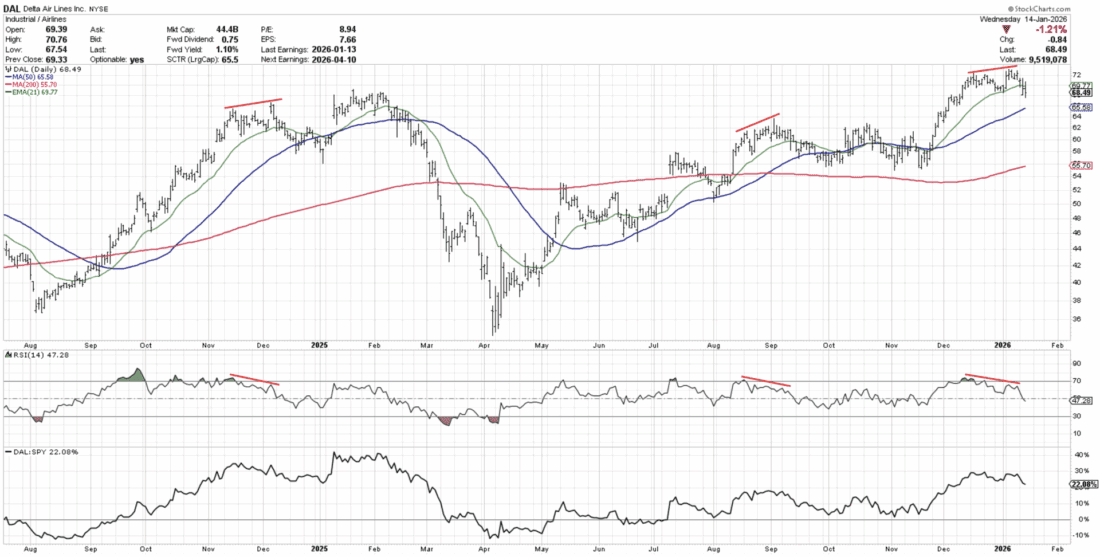
DAL has experienced a series of bearish momentum divergences at major tops over the last 18 months, formed by higher price action combined with lower peaks in price momentum. Short-term tops in December 2024 and September 2025 were both preceded by this ominous technical configuration.
Will the recent signal lead to another short-term pullback, or instead will we see a more significant bear phase? The RSI itself could serve as an important way of validating the length and depth of a new downtrend. After those previous divergences, the RSI held the 40 level on pullbacks. The more painful corrective phase in Q1 2025 saw the RSI push below 40 soon after the peak, serving to confirm a more extended bearish move.
—
Originally posted 15th January 2026
Investopedia.com: The comments, opinions and analyses expressed herein are for informational purposes only and should not be considered individual investment advice or recommendations to invest in any security or to adopt any investment strategy. While we believe the information provided herein is reliable, we do not warrant its accuracy or completeness. The views and strategies described on our content may not be suitable for all investors. Because market and economic conditions are subject to rapid change, all comments, opinions and analyses contained within our content are rendered as of the date of the posting and may change without notice. The material is not intended as a complete analysis of every material fact regarding any country, region, market, industry, investment or strategy. This information is intended for US residents only.
Information posted on IBKR Campus that is provided by third-parties does NOT constitute a recommendation that you should contract for the services of that third party. Third-party participants who contribute to IBKR Campus are independent of Interactive Brokers and Interactive Brokers does not make any representations or warranties concerning the services offered, their past or future performance, or the accuracy of the information provided by the third party. Past performance is no guarantee of future results.
This material is from Investopedia and is being posted with its permission. The views expressed in this material are solely those of the author and/or Investopedia and Interactive Brokers is not endorsing or recommending any investment or trading discussed in the material. This material is not and should not be construed as an offer to buy or sell any security. It should not be construed as research or investment advice or a recommendation to buy, sell or hold any security or commodity. This material does not and is not intended to take into account the particular financial conditions, investment objectives or requirements of individual customers. Before acting on this material, you should consider whether it is suitable for your particular circumstances and, as necessary, seek professional advice.
Any discussion or mention of an ETF is not to be construed as recommendation, promotion or solicitation. All investors should review and consider associated investment risks, charges and expenses of the investment company or fund prior to investing. Before acting on this material, you should consider whether it is suitable for your particular circumstances and, as necessary, seek professional advice.
Related Articles


Join The Conversation
For specific platform feedback and suggestions, please submit it directly to our team using these instructions.
If you have an account-specific question or concern, please reach out to Client Services.
We encourage you to look through our FAQs before posting. Your question may already be covered!