
- Solve real problems with our hands-on interface
- Progress from basic puts and calls to advanced strategies
Interactive Options Course
Posted October 31, 2025 at 10:43 am
By Todd Stankiewicz, CMT, CFP, ChFC
1/ Daily S&P 500: Short-Term Signals Flash Caution
2/ Weekly S&P 500: Divergence Signals Growing Risk
3/ Monthly S&P500: Long-Term Context and Historical Parallels
4/ Integrating Timeframes for Smarter Risk Management
Investopedia is partnering with CMT Association on this newsletter. The contents of this newsletter are for informational and educational purposes only, however, and do not constitute investing advice. The guest authors, which may sell research to investors, and may trade or hold positions in securities mentioned herein do not represent the views of CMT Association or Investopedia. Please consult a financial advisor for investment recommendations and services.
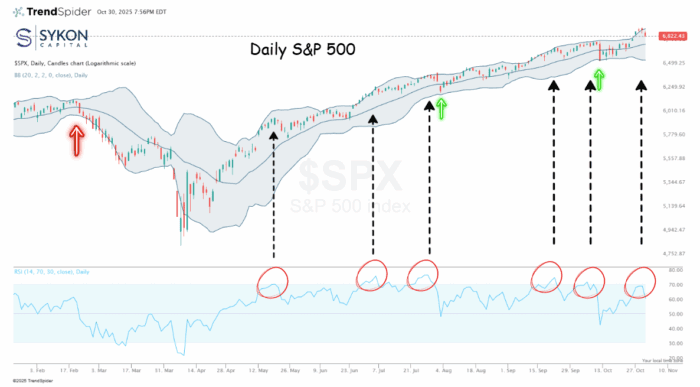
Daily S&P 500: Short-Term Signals Flash Caution
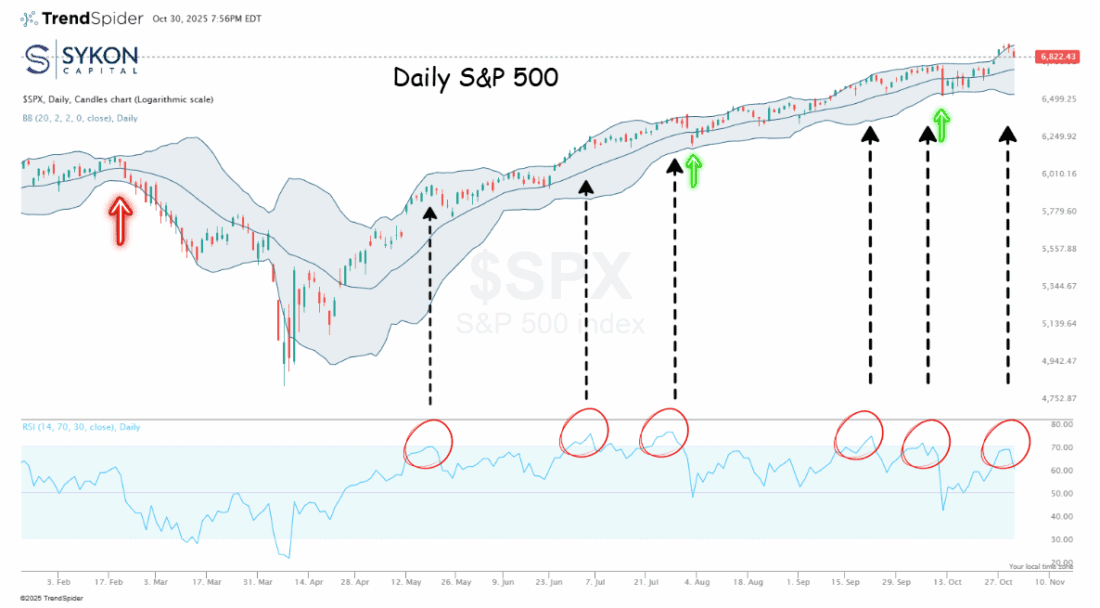
The S&P 500 reached a new all-time high this week before reversing course following Wednesday’s Federal Reserve decision. The market’s negative reaction stemmed from the Fed’s commentary on increased inflationary pressures and potential downside risks to employment, a combination that raises concerns about economic growth ahead.
From a technical perspective, the timing of this reversal is significant. The index approached overbought territory on the RSI (Relative Strength Index) just as the Fed announcement hit, creating a natural inflection point. The daily chart now suggests a potential pullback toward the 6,700 level, which represents the middle Bollinger Band, a key support zone that has historically provided a floor during corrections.
The critical level to watch below that is 6,550, marking the lower Bollinger Band. A breach of this level would signal that the pullback could extend further, similar to the February-March period earlier this year when the market experienced a more significant decline. This pattern underscores the importance of disciplined risk management and understanding your technical levels.
For traders and investors maintaining long positions, the strategy is clear: monitor whether the index can hold the middle Bollinger Band around 6,700. If that level provides support,
the uptrend likely remains intact. However, if we see a breakdown below 6,550, it may be prudent to reassess exposure or tighten stop-loss levels.
The daily timeframe serves as your early warning system, it’s where momentum shifts first appear and where short-term traders must be most vigilant. While a pullback from overbought levels is normal and healthy in any bull market, the key is distinguishing between a routine consolidation and the beginning of something more concerning. That’s where the weekly and monthly perspectives become essential.
Weekly S&P 500: Divergence Signals Growing Risk
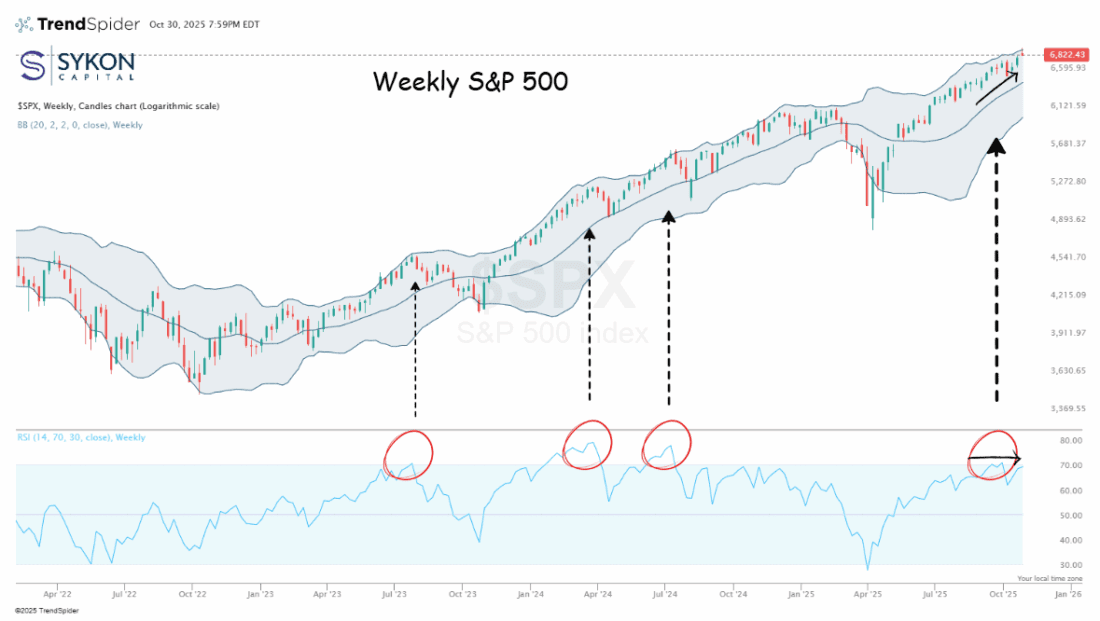
The weekly chart reveals a more concerning technical picture that demands attention. While the S&P 500 made a new all-time high this week, the RSI is telling a different story, one that suggests underlying weakness may be developing beneath the surface.
This week’s new high came with an RSI reading of approximately 69.20, but the previous highs made in late September showed RSI at roughly 70.8. This creates a classic bearish RSI divergence: the price is making higher highs while momentum is making lower highs. Historically, this pattern has preceded meaningful corrections and serves as a warning that the rally may be losing steam.
Adding to the cautionary signals, we’re currently riding the upper Bollinger Band while RSI sits in overbought territory above 70. Looking back at similar setups provides valuable context: July 2024, March 2024, and July 2023 all showed overbought RSI levels at market peaks, and each was followed by notable pullbacks.
The weekly Bollinger Bands provide our roadmap for potential support levels. The middle band sits at approximately 6,460, while the lower band rests just above 6,000. Here’s where the multi-timeframe analysis becomes particularly valuable: notice that the daily chart’s lower Bollinger Band at 6,550 sits above the weekly chart’s middle Bollinger Band at 6,460. This means we’d need to breach the daily lower band before even testing the weekly middle band, a scenario that would represent a more significant correction.
The weekly timeframe bridges the gap between short-term noise and long-term trends. It’s where intermediate-term investors should focus their attention, as it filters out daily volatility while remaining responsive enough to identify developing trends before they become obvious on monthly charts.
Monthly S&P500: Long-Term Context and Historical Parallels
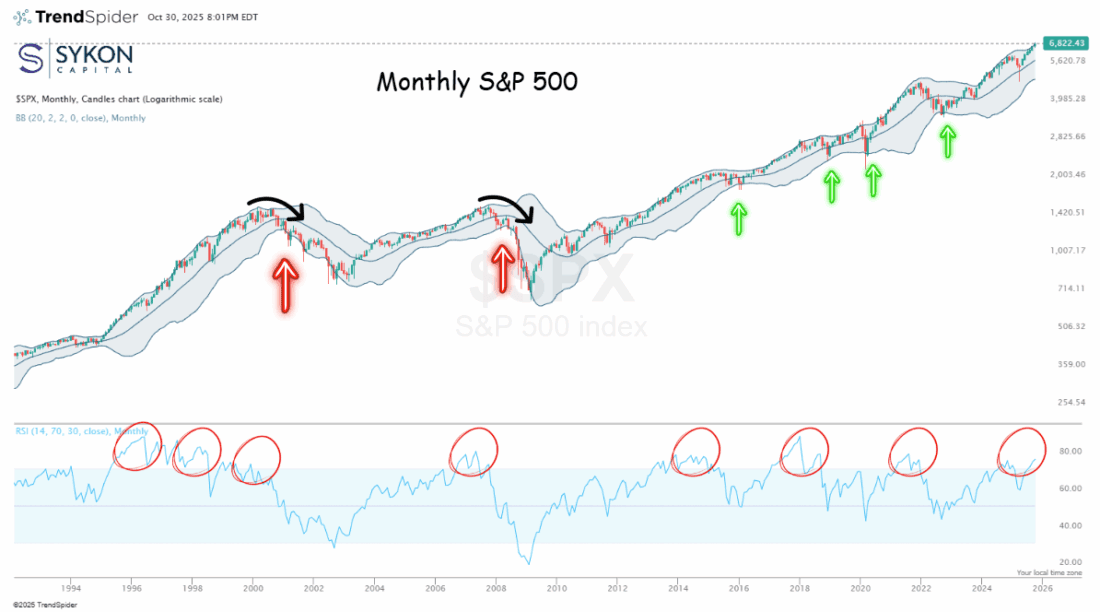
The monthly chart provides the most important perspective for long-term investors, and right now it’s flashing signals that warrant careful attention. Based on Thursday’s close, the RSI is reading approximately 75.24, firmly in overbought territory, while the index rides the upper Bollinger Band. This combination has historically preceded periods of consolidation or correction.
Historical precedents offer valuable lessons. We saw overbought monthly RSI in November 2024, followed by a sharp first-half 2025 selloff. Going further back, a cluster of overbought readings in August, November, and December 2021 preceded the challenging 2022 environment. January 2018 marked the beginning of a series of bearish divergences that culminated in the fourth-quarter 2018 sell off. Even the December 2013 through November 2014 overbought period eventually led to the mid-to-late 2015 correction.
Importantly, none of these instances resulted in catastrophic bear markets, they were corrections within a secular bull trend. This context is crucial because it highlights that we’ve been in a remarkably durable uptrend since the March 2009 lows. The market has rarely breached the lower monthly Bollinger Band during this entire period.
Currently, the middle Bollinger Band on the monthly chart sits around 5,860, with the lower band at approximately 4,900. Historical patterns show that when we’ve tested the middle band – like we did in February 2016, December 2018, March 2020, and September 2022 – we’ve often come close to the lower band but haven’t breached it. The only times we truly broke through the lower monthly Bollinger Band were June 2008 and January 2001, both preceding major, multi-year bear markets that followed overbought RSI conditions.
The monthly timeframe reminds us that while short-term volatility is inevitable, the long-term trend remains your friend, until it definitively breaks.
Integrating Timeframes for Smarter Risk Management
The beauty of multi-timeframe analysis lies in how each perspective informs the others, creating a comprehensive risk management framework. The daily chart provides your tactical entry and exit signals, the weekly chart confirms or questions the sustainability of trends, and the monthly chart keeps you grounded in the bigger picture.
Right now, all three timeframes are sending similar messages: we’re overbought, momentum is waning, and a period of consolidation or correction appears likely. However, the severity and duration of any pullback will depend on which support levels hold. A bounce at the daily middle Bollinger Band (6,700) would suggest just a minor reset. Breaking the daily lower band (6,550) and testing the weekly middle band (6,460) would indicate a more meaningful correction. Only a breach of the monthly middle band (5,860) would suggest something more serious is developing.
This isn’t a binary sell-or-hold decision. It’s about understanding your risk profile and adjusting accordingly. Short-term traders should respect the overbought conditions and tighten stops. Long-term investors might view any pullback as a healthy reset within a secular bull market that’s been intact since 2009. The key is discipline: know your levels, respect the technicals, and remember that markets don’t move in straight lines. Pullbacks are normal; how you manage them determines your success.
—
Originally posted 31st October 2025
Investopedia.com: The comments, opinions and analyses expressed herein are for informational purposes only and should not be considered individual investment advice or recommendations to invest in any security or to adopt any investment strategy. While we believe the information provided herein is reliable, we do not warrant its accuracy or completeness. The views and strategies described on our content may not be suitable for all investors. Because market and economic conditions are subject to rapid change, all comments, opinions and analyses contained within our content are rendered as of the date of the posting and may change without notice. The material is not intended as a complete analysis of every material fact regarding any country, region, market, industry, investment or strategy. This information is intended for US residents only.
Information posted on IBKR Campus that is provided by third-parties does NOT constitute a recommendation that you should contract for the services of that third party. Third-party participants who contribute to IBKR Campus are independent of Interactive Brokers and Interactive Brokers does not make any representations or warranties concerning the services offered, their past or future performance, or the accuracy of the information provided by the third party. Past performance is no guarantee of future results.
This material is from Investopedia and is being posted with its permission. The views expressed in this material are solely those of the author and/or Investopedia and Interactive Brokers is not endorsing or recommending any investment or trading discussed in the material. This material is not and should not be construed as an offer to buy or sell any security. It should not be construed as research or investment advice or a recommendation to buy, sell or hold any security or commodity. This material does not and is not intended to take into account the particular financial conditions, investment objectives or requirements of individual customers. Before acting on this material, you should consider whether it is suitable for your particular circumstances and, as necessary, seek professional advice.
Related Articles


Join The Conversation
For specific platform feedback and suggestions, please submit it directly to our team using these instructions.
If you have an account-specific question or concern, please reach out to Client Services.
We encourage you to look through our FAQs before posting. Your question may already be covered!