
- Solve real problems with our hands-on interface
- Progress from basic puts and calls to advanced strategies
Interactive Options Course
Posted August 11, 2025 at 8:54 am
From SIA Charts
1/ United Parcel Service Inc. (UPS)
2/ Candlestick Chart
3/ Point and Figure Chart
Investopedia is partnering with CMT Association on this newsletter. The contents of this newsletter are for informational and educational purposes only, however, and do not constitute investing advice. The guest authors, which may sell research to investors, and may trade or hold positions in securities mentioned herein do not represent the views of CMT Association or Investopedia. Please consult a financial advisor for investment recommendations and services.
United Parcel Service Inc. (UPS)

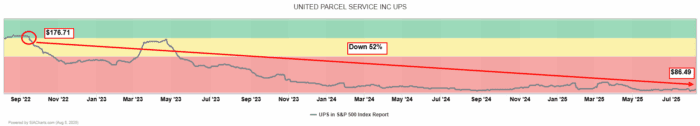
In today’s edition of the Daily Stock Report, we are going to provide an update on United Parcel Service (UPS). The last time we highlighted United Parcel Service (UPS) in our commentary’s was almost four months ago on March 26, 2025. Back then, the shares were exhibiting a steady downtrend since its peak in early 2022. The shares were deeply entrenched in the red unfavored zone of many of the reports it was found in on the SIA Platform including the SIA S&P 500 Index. The SIA Platform issued a Yellow Neutral Zone with a Red SMAX signal back on September 16, 2022, at a price of $176.71. At the time of our last commentary on March 26, 2025, the shares were at $109.96 which represented an approximately 40% drop in price since the yellow neutral zone signal. Since then, the shares have continued to weaken further as the closing price is now at $86.49 which represents an additional 27% drop since the March 26, 2025 closing price. This represents a total decline in price of almost 52% since September of 2022. This exemplifies the example of staying away from investments in the red unfavored zone. Capital preservation and avoiding portfolio destruction are important concepts at SIA. Many advisors may instinctively look for names in the unfavored zone with the mentality that the shares are oversold and a “value buy” is in play. However, “value buys” may in fact be “value traps” and the shares may continue to fall further in price which is in fact what has occurred here.
Candlestick Chart
In looking at the candlestick chart we still see a steady pattern of lower highs and lower lows. The two long red candlesticks in late January and last week is indicative of the disappointing quarterly earnings releases with an increase in Volume. In last week’s earnings release the company reported mixed quarterly results and declined to offer full-year guidance, citing macroeconomic uncertainty which the market took a disliking to. What is most interesting is the SIA relative strength readings was already hinting at negative news for several months even before the earnings announcement as the SIA Platform had indicated deteriorating money flows well before January and last week’s news. Currently, the shares made a new lower low and next support really isn’t found until the $70 area, levels not seen since the March 2020 Covid meltdown. This will be an important level to watch to see if the shares can find support there. Resistance may be found at the short but brief rally at a little over a $100 prior to the last earnings release.

Point and Figure Chart
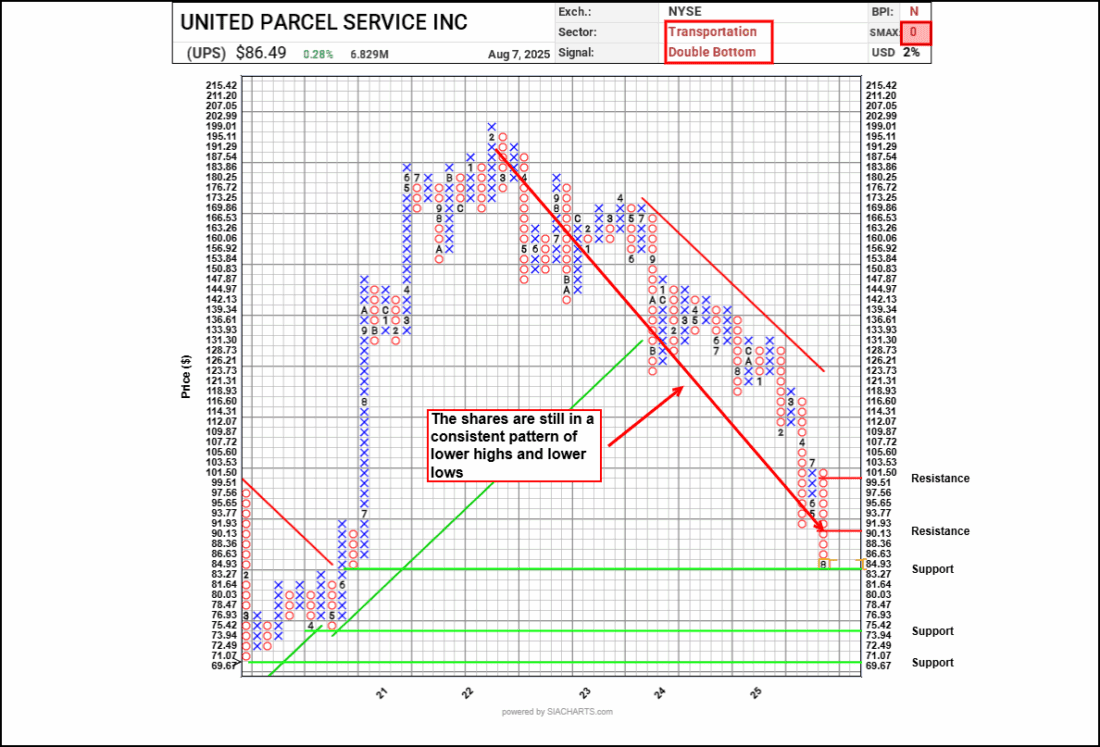
Let’s dive in and see what the Point and Figure Chart looks like today. Once again, the picture has not changed with a consistent pattern of lower highs and lower lows. In March’s update we identified support levels at $109.49 and below that, the $97.22 to $93.45 area which has failed to hold. As such the downward trend is still firmly intact as a new lower low has transpired this month with a column of O’s lasting 10 boxes thus far. Currently the shares are exhibiting a bearish double bottom pattern. The shares may find some minor support right here at $83.27 coinciding with where the shares were in the June 2020 level. Below that, next support is staggered at $73.94 and then $69.67 potentially halting further declines. To the upside, resistance is at its 3 box reversal of $91.93 and above that, the $100 round number and psychological level. With a SMAX score of 0 out of 10, UPS is not exhibiting any near term strength whatsoever against the asset classes and also has a negative sector backdrop as the Transportation Sector is ranked unfavored with SIA Market Sector Report.
—
Originally posted 8th August 2025
Investopedia.com: The comments, opinions and analyses expressed herein are for informational purposes only and should not be considered individual investment advice or recommendations to invest in any security or to adopt any investment strategy. While we believe the information provided herein is reliable, we do not warrant its accuracy or completeness. The views and strategies described on our content may not be suitable for all investors. Because market and economic conditions are subject to rapid change, all comments, opinions and analyses contained within our content are rendered as of the date of the posting and may change without notice. The material is not intended as a complete analysis of every material fact regarding any country, region, market, industry, investment or strategy. This information is intended for US residents only.
Information posted on IBKR Campus that is provided by third-parties does NOT constitute a recommendation that you should contract for the services of that third party. Third-party participants who contribute to IBKR Campus are independent of Interactive Brokers and Interactive Brokers does not make any representations or warranties concerning the services offered, their past or future performance, or the accuracy of the information provided by the third party. Past performance is no guarantee of future results.
This material is from Investopedia and is being posted with its permission. The views expressed in this material are solely those of the author and/or Investopedia and Interactive Brokers is not endorsing or recommending any investment or trading discussed in the material. This material is not and should not be construed as an offer to buy or sell any security. It should not be construed as research or investment advice or a recommendation to buy, sell or hold any security or commodity. This material does not and is not intended to take into account the particular financial conditions, investment objectives or requirements of individual customers. Before acting on this material, you should consider whether it is suitable for your particular circumstances and, as necessary, seek professional advice.
Related Articles


Join The Conversation
For specific platform feedback and suggestions, please submit it directly to our team using these instructions.
If you have an account-specific question or concern, please reach out to Client Services.
We encourage you to look through our FAQs before posting. Your question may already be covered!