
- Solve real problems with our hands-on interface
- Progress from basic puts and calls to advanced strategies
Interactive Options Course
Posted July 15, 2025 at 4:55 am
1/ U.S. 10-Year Yield: Directionless, But with Potential to Dominate Macro Trends
2/ Dollar Index Breaks Down—but Don’t Count Out a Rebound
3/ Gold Takes a Breather—Not a Backstep
Investopedia is partnering with CMT Association on this newsletter. The contents of this newsletter are for informational and educational purposes only, however, and do not constitute investing advice. The guest authors, which may sell research to investors, and may trade or hold positions in securities mentioned herein do not represent the views of CMT Association or Investopedia. Please consult a financial advisor for investment recommendations and services.
U.S. 10-Year Yield: Directionless, But with Potential to Dominate Macro Trends
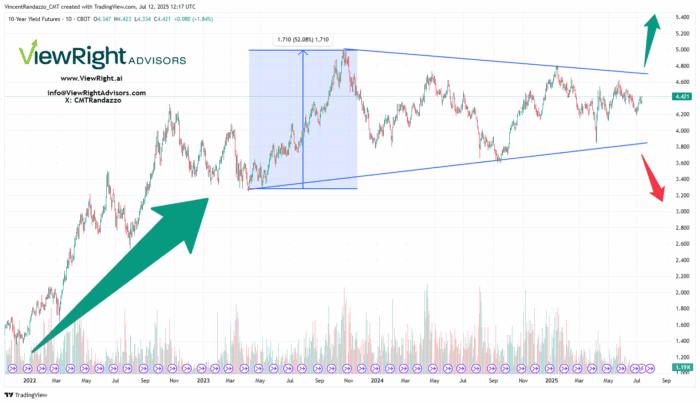
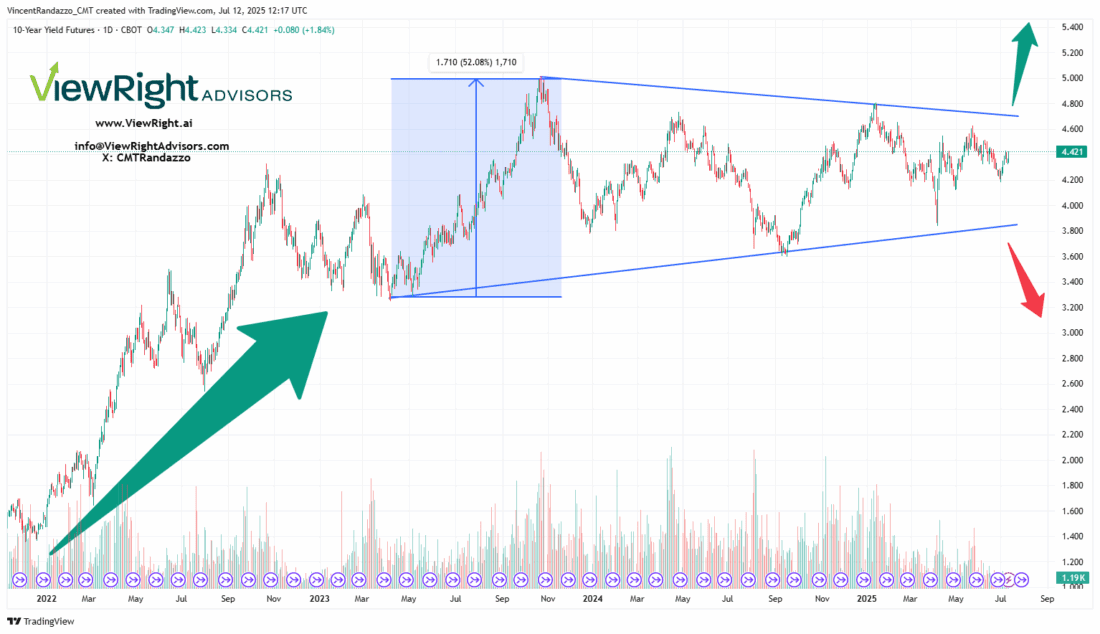
When it comes to macro influence, few charts rival the U.S. 10-Year Treasury Yield (TNX). It affects everything from mortgage rates to equity valuations, risk appetite to sector leadership. But for all its weight, the yield has gone nowhere lately, stuck in a wide, volatile range following a historic surge from pandemic-era lows.
From a technical analysis perspective, we’ve connected the major lower highs with a descending trendline and the higher lows with an ascending one, forming what resembles a triangle pattern. These setups often act as continuation patterns, with breakouts more likely to occur in the direction of the preceding move. In this case, that suggests an eventual breakout higher in yields and lower in bond prices.
A measured move from the breakout point could target a shift of roughly 170 basis points—the approximate height of the pattern’s base. That would imply a potential surge to above 6.4% if the breakout occurs near 4.7%. On the flip side, a break below the rising trendline of the triangle around 3.8% would suggest a retracement back toward 2%. With the current yield around 4.4%, this puts it nearly equidistant from breakout and down levels.
Though the range-bound price action may appear uneventful, beneath the surface, the implications are profound. A decisive move in either direction could ripple through global equity markets, currency valuations, and commodity prices. With global debt loads at record highs, the stakes are elevated—this may not just be the most important chart of the moment, but potentially of the decade.
Dollar Index Breaks Down—but Don’t Count Out a Rebound
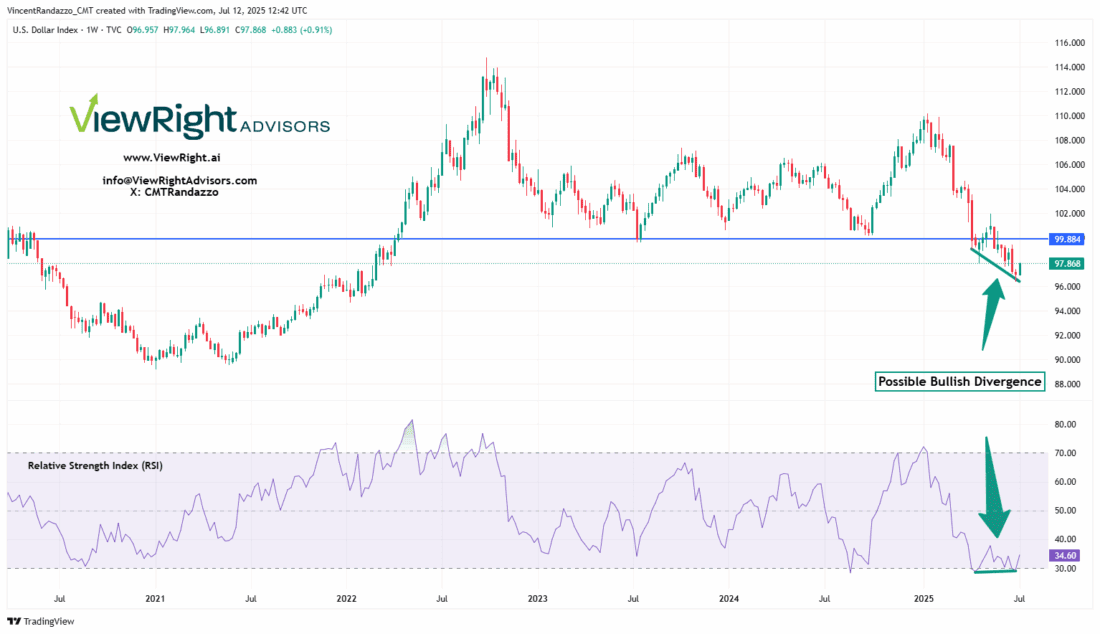
When it comes to macro influence, few charts rival the U.S. 10-Year Treasury Yield (TNX). It affects everything from mortgage rates to equity valuations, risk appetite to breakdown below the 100 level—a round number and widely watched psychological support—confirmed a structural shift in trend, opening the door to a longer-term move toward the 90 level. This zone, around 100, previously a ceiling for years, had flipped to support—until that support gave way on a weekly closing basis.
While this break was technically meaningful, momentum signals suggest that a short-term rebound could be in the cards. The Relative Strength Index (RSI)—a commonly used momentum oscillator—has been declining but has notably failed to push below the 30 threshold, which typically signals oversold conditions. That resilience hints at underlying demand even amid broader weakness.
RSI readings are more effective in range-bound or gradual-trending markets, and in strong directional trends, they can stay overbought or oversold for extended periods without consequence. However, the inability to confirm the DXY’s price breakdown with a deeper RSI drop creates a possible bullish divergence.
Adding to the case is the formation of a potential falling wedge—a classic bullish reversal pattern—combined with increasingly bearish sentiment surrounding the dollar. Taken together, these conditions suggest the dollar may be primed for at least a tactical bounce.
If a rally does develop, the key test will be whether the DXY can reclaim and hold above the 100 level on a consecutive weekly closing basis. A move back above that threshold would suggest the recent decline was more corrective than trend-ending.
Gold Takes a Breather—Not a Backstep
Gold continues to assert itself as one of the strongest trending assets in the market, printing new all-time highs multiple times in recent months. In environments like this—where price is extended but not reversing—simple, trend-respecting tools tend to be more effective than oscillators or countertrend indicators.
Rather than searching for a top, we’ve leaned on moving averages and price envelopes to frame the current action. Price envelopes are bands plotted above and below a selected moving average, often used to identify overbought or oversold conditions relative to trend. In this case, the 20-week moving average with a percentage buffer has provided a helpful structure for capturing gold’s stair-step advances without getting shaken out by short-term noise and reducing the risk of whipsaw signals.
Over the past two years, gold has respected the upper and lower bounds of its envelope remarkably well, often finding support at the midline (the moving average) during consolidations. While the metal has struggled to push meaningfully above $3,400 in recent weeks, this pause appears more like digestion than distribution. The envelope itself remains in a clear uptrend, suggesting the broader momentum is intact.
With strong trending assets, simplicity often yields better results. In this case, the path of least resistance still points higher, even if the short-term action remains choppy. Unless the price decisively violates the lower boundary of its envelope or the trend in the moving average turns down, the evidence continues to favor eventual continuation.
In short, this is a breather, not a backstep. And in strong uptrends, that distinction can make all the difference.

—
Originally posted 14th July 2025
Investopedia.com: The comments, opinions and analyses expressed herein are for informational purposes only and should not be considered individual investment advice or recommendations to invest in any security or to adopt any investment strategy. While we believe the information provided herein is reliable, we do not warrant its accuracy or completeness. The views and strategies described on our content may not be suitable for all investors. Because market and economic conditions are subject to rapid change, all comments, opinions and analyses contained within our content are rendered as of the date of the posting and may change without notice. The material is not intended as a complete analysis of every material fact regarding any country, region, market, industry, investment or strategy. This information is intended for US residents only.
Information posted on IBKR Campus that is provided by third-parties does NOT constitute a recommendation that you should contract for the services of that third party. Third-party participants who contribute to IBKR Campus are independent of Interactive Brokers and Interactive Brokers does not make any representations or warranties concerning the services offered, their past or future performance, or the accuracy of the information provided by the third party. Past performance is no guarantee of future results.
This material is from Investopedia and is being posted with its permission. The views expressed in this material are solely those of the author and/or Investopedia and Interactive Brokers is not endorsing or recommending any investment or trading discussed in the material. This material is not and should not be construed as an offer to buy or sell any security. It should not be construed as research or investment advice or a recommendation to buy, sell or hold any security or commodity. This material does not and is not intended to take into account the particular financial conditions, investment objectives or requirements of individual customers. Before acting on this material, you should consider whether it is suitable for your particular circumstances and, as necessary, seek professional advice.
Futures are not suitable for all investors. The amount you may lose may be greater than your initial investment. Before trading futures, please read the CFTC Risk Disclosure. A copy and additional information are available at ibkr.com.
There is a substantial risk of loss in foreign exchange trading. The settlement date of foreign exchange trades can vary due to time zone differences and bank holidays. When trading across foreign exchange markets, this may necessitate borrowing funds to settle foreign exchange trades. The interest rate on borrowed funds must be considered when computing the cost of trades across multiple markets.
Spot currencies are not available at IBKR Singapore.
Municipal Bonds are only available from Interactive Brokers for IBKR LLC, IBKR Canada, IBKR Hong Kong, IBKR Australia and IBKR Singapore entities.
Related Articles


Join The Conversation
For specific platform feedback and suggestions, please submit it directly to our team using these instructions.
If you have an account-specific question or concern, please reach out to Client Services.
We encourage you to look through our FAQs before posting. Your question may already be covered!