
- Solve real problems with our hands-on interface
- Progress from basic puts and calls to advanced strategies
Interactive Options Course

Posted December 11, 2025 at 9:53 am
Comparing Asset Classes
Investopedia is partnering with CMT Association on this newsletter. The contents of this newsletter are for informational and educational purposes only, however, and do not constitute investing advice. The guest authors, which may sell research to investors, and may trade or hold positions in securities mentioned herein do not represent the views of CMT Association or Investopedia. Please consult a financial advisor for investment recommendations and services.
Welcome to the 4th day of “Chartmas.”
We’ve got today’s issue and one more to go (tomorrow), so let’s compare a couple asset classes to one another and see where the market momentum is flowing.
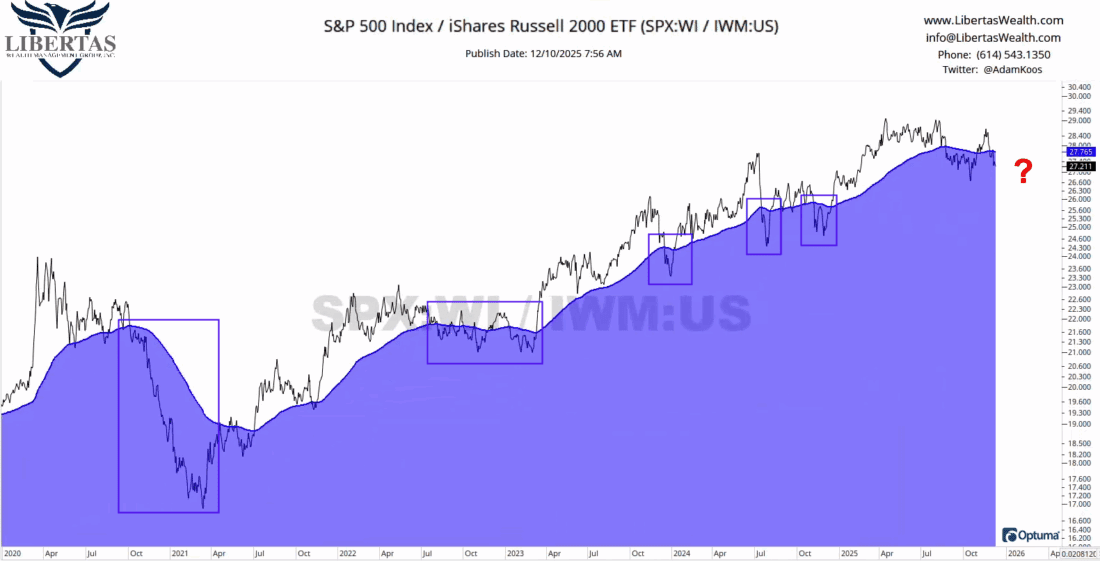
First up, large cap stocks vs. small cap stocks…
For those who are new to a relative strength (relative comparison) chart that pins one investment against another, what you’re looking at below is NOT a chart of the S&P500 or the IWM. It’s a snapshot of the historical battle between the two.
Whichever ticker is in the numerator (the one you type first) is the one that’s winning if the chart is trending up… and the ticker that’s typed second (i.e., the denominator) is winning if the chart is trending down. I add a 150-day moving average to all my RS charts, just to have a line-in-the-sand below (or above) which to determine which investment is in the lead.
You can actually execute one of these on your own, for free, at StockCharts.com. Just take the first symbol, add a colon, and then type the second symbol, and what will pop up is the RS chart. (Nerd’s Note: You’ll want to change it to a line chart if it pops up as a bar or candlestick chart, then turn off the volume indicator, and add a 150MA to make it look like this one, but hopefully that helps).
But anyway, back to the chart – and what we see here is, since COVID, there have been a few short periods of small cap outperformance over the S&P500, but nothing sustainable.
Today, however, I’m seeing a lower top in the RS chart below, so a short-term downtrend, combined with a second drop below the 150MA… and if you combine this relative action with the absolute price action of small caps, this is looking like a good entry point
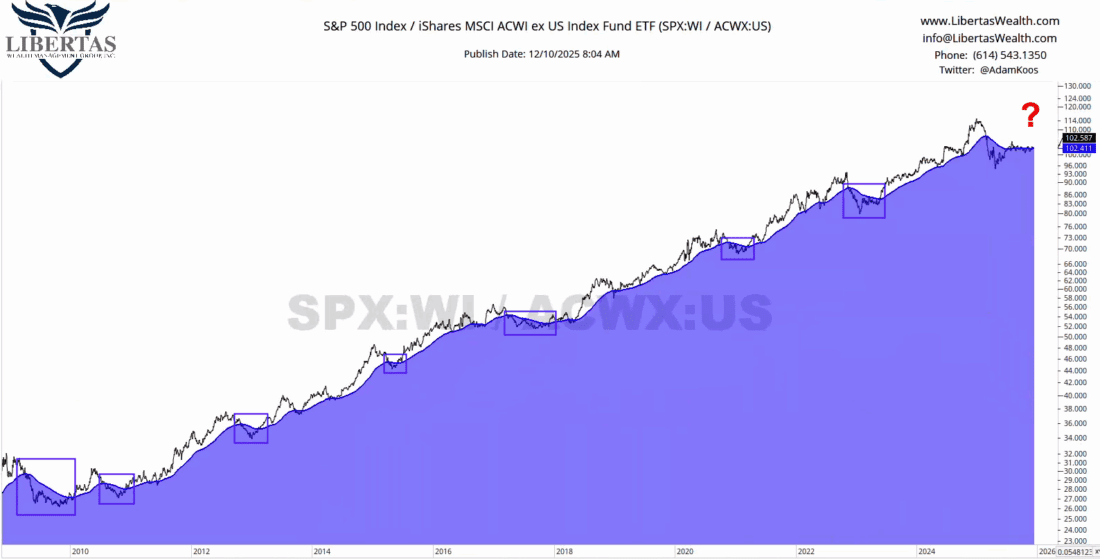
Next is a longer, zoomed-out chart of the battle between U.S. and international stocks. I purposely zoomed out to 2009 because I wanted to make it clear that the U.S. has generally been the best place for our hard-earned retirement savings for a long… long time.
Again, you can see intermittent periods of underperformance in the S&P500 vs. the All-Country World Index (ex-US), but those time periods when international stocks were winning were… well, short-lived.
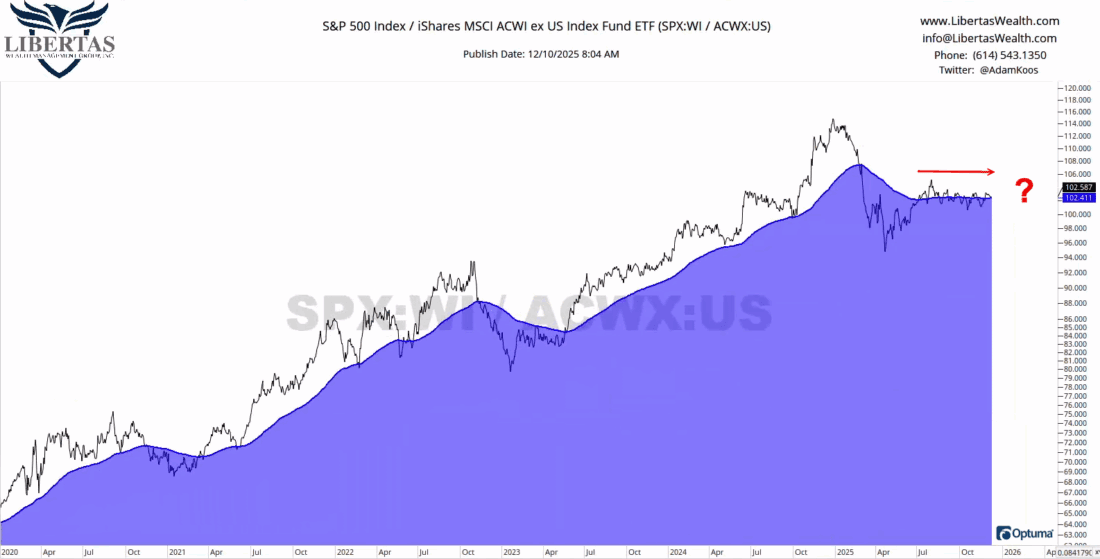
The recent picture between the U.S. and stocks overseas is easier to see in the chart below (I just zoomed in and started w/ 2020).
As you can see, international stocks became the winner earlier this year, just like they did in late-2022, but the battle shifted and currently rides on the 150MA, indicating a ‘trendless’ comparison at the moment.
However, this chart is going to resolve one way or the other, and it’s possible that this time could (finally) be the big pivot – where the U.S. loses ground to stocks around the world – but we’re just going to continue monitoring it and wait for the market to prove itself instead of speculating (i.e., trying to “predict” the trend… a practice that often brings nothing more than frustration).
Lastly, while I usually don’t like to talk about the “why,” one of the reasons “why” the U.S. vs. International stock relationship is changing is due to the U.S. Dollar weakening this year.
When the Dollar climbs in value vs. other world currencies, all things held constant, U.S. stocks tend to outperform due to the exchange rate between each country and the stocks that reside in each country, respectively.
When the Dollar falls in value vs. other world currencies, all things held constant, international stocks tend to outperform (for the very same reason).
Looking back in time, during COVID, the Dollar struggled, but made a huge comeback, peaking out in fall of 2022.
From there, it pulled back and chopped sideways through 2023 and 2024, when in the first quarter of 2025, it attempted to head back toward those 2022 highs… but failed, broke down, failed again to breakout… and now we see the Dollar trying to find the hole in the ice through which it fell, as it tries to climb back up & out from the icy, (polar) bearish water.
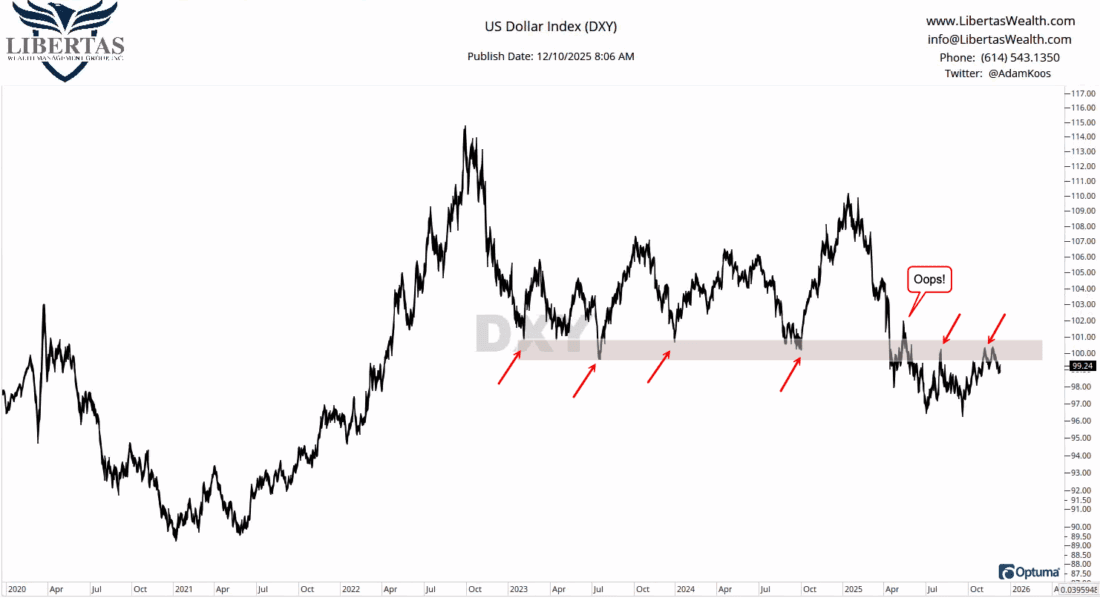
So if the USD continues to struggle and find itself drowning in that icy water below the ceiling of overhead resistance marked in the shaded area above, there’s a good chance we’ll see a long-term shift in momentum, where the strongest stocks in the coming months and years could end up being outside the U.S.
If you have any questions at all, feel free to email me personally, below.
Otherwise, stay tuned for day four of “The 5 Days of Chartmas” in tomorrow’s issue, and thanks, as always, for taking the time to read!
—
Originally posted 11th December 2025
Investopedia.com: The comments, opinions and analyses expressed herein are for informational purposes only and should not be considered individual investment advice or recommendations to invest in any security or to adopt any investment strategy. While we believe the information provided herein is reliable, we do not warrant its accuracy or completeness. The views and strategies described on our content may not be suitable for all investors. Because market and economic conditions are subject to rapid change, all comments, opinions and analyses contained within our content are rendered as of the date of the posting and may change without notice. The material is not intended as a complete analysis of every material fact regarding any country, region, market, industry, investment or strategy. This information is intended for US residents only.
Information posted on IBKR Campus that is provided by third-parties does NOT constitute a recommendation that you should contract for the services of that third party. Third-party participants who contribute to IBKR Campus are independent of Interactive Brokers and Interactive Brokers does not make any representations or warranties concerning the services offered, their past or future performance, or the accuracy of the information provided by the third party. Past performance is no guarantee of future results.
This material is from Investopedia and is being posted with its permission. The views expressed in this material are solely those of the author and/or Investopedia and Interactive Brokers is not endorsing or recommending any investment or trading discussed in the material. This material is not and should not be construed as an offer to buy or sell any security. It should not be construed as research or investment advice or a recommendation to buy, sell or hold any security or commodity. This material does not and is not intended to take into account the particular financial conditions, investment objectives or requirements of individual customers. Before acting on this material, you should consider whether it is suitable for your particular circumstances and, as necessary, seek professional advice.
Any discussion or mention of an ETF is not to be construed as recommendation, promotion or solicitation. All investors should review and consider associated investment risks, charges and expenses of the investment company or fund prior to investing. Before acting on this material, you should consider whether it is suitable for your particular circumstances and, as necessary, seek professional advice.
There is a substantial risk of loss in foreign exchange trading. The settlement date of foreign exchange trades can vary due to time zone differences and bank holidays. When trading across foreign exchange markets, this may necessitate borrowing funds to settle foreign exchange trades. The interest rate on borrowed funds must be considered when computing the cost of trades across multiple markets.
Spot currencies are not available at IBKR Singapore.
Related Articles


Join The Conversation
For specific platform feedback and suggestions, please submit it directly to our team using these instructions.
If you have an account-specific question or concern, please reach out to Client Services.
We encourage you to look through our FAQs before posting. Your question may already be covered!