
- Solve real problems with our hands-on interface
- Progress from basic puts and calls to advanced strategies
Interactive Options Course

Posted January 16, 2026 at 10:15 am
There’s a tale, perhaps partly apocryphal, about Thales of Miletus, the 6th-century BC philosopher. According to Aristotle, Thales was mocked for being poor and too focused on philosophy. To prove that wisdom could be profitable, he predicted a strong olive harvest while it was still winter.
He used his limited capital to pay small, upfront deposits that effectively reserved olive-press capacity for the coming harvest. Not to buy the presses, but to secure the right of first use at a pre-agreed, low cost. In winter, that right was cheap because nobody knew whether the harvest would be large. When the harvest turned out strong, pressing capacity became scarce. Since Thales had already reserved most of it, latecomers had to go through him, and he could sublet those slots at a premium rate.
This is often cited as an early precursor to futures, but the lesson is this: Thales positioned himself at the point of scarcity. That’s where value accrues. In commodities investing, a common way to seek a similar edge is to analyse the shape and evolution of futures curves.
After analysing how trends work in commodities, we continue to dissect our recent research paper, ‘Commodity Investing 3.0: The Rise of Factor and Curve-Aware Strategies.’ In this blog, we focus on two of the most important signals in commodity markets: carry and slope momentum. Again, we tested the three metrics both cross-sectionally and in time series. Cross-sectionally, we rank commodities by signal strength to identify relative winners and losers, forming terciles that represent high-, medium-, and low-signal commodities. In a time-series setup, each commodity is evaluated against its own historical performance rather than against its peers, producing a directional signal: long if the factor is positive, and short if the factor is negative.
Carry, defined as the implied roll yield derived from the futures curve, is one of the most empirically robust sources of return in commodities. It balances inventories, storage costs, hedging pressure and convenience yield. The main theoretical explanation behind this factor1 states that when inventories are tight, the convenience yield rises, pushing the curve into backwardation2 and rewarding long future contract holders with a positive expected roll return. When inventories are abundant, the opposite occurs, creating negative carry. In this case, investors experience what is in jargon called ‘roll drag’, which is the performance loss that occurs when a futures curve is in contango3: as the position is rolled forward, the investor repeatedly buys a more expensive contract and sells a cheaper one, creating a negative yield that steadily erodes returns.
We test carry using two definitions:
Our results confirm the robustness of carry as a return driver over the last 25 years, primarily in cross-sectional analysis. In contrast to previous research papers, the time-series results are underwhelming, but the cross-sectional results are strong for both carry definitions. Ranking commodities by their relative roll yield consistently identifies where scarcity is most acute. Performance and significance are similar in both definitions. The main difference is that:
In our tests, both versions delivered more than 5% annualised long–short excess returns, but front-month carry produced significantly higher weekly turnover (15%) than the 12-month version (9%). The chart below displays the three commodity terciles for the 12-month roll yield and the long-short performance (in yellow) of a strategy that goes long on the first tercile (high relative carry) and short on the third one (low relative carry).
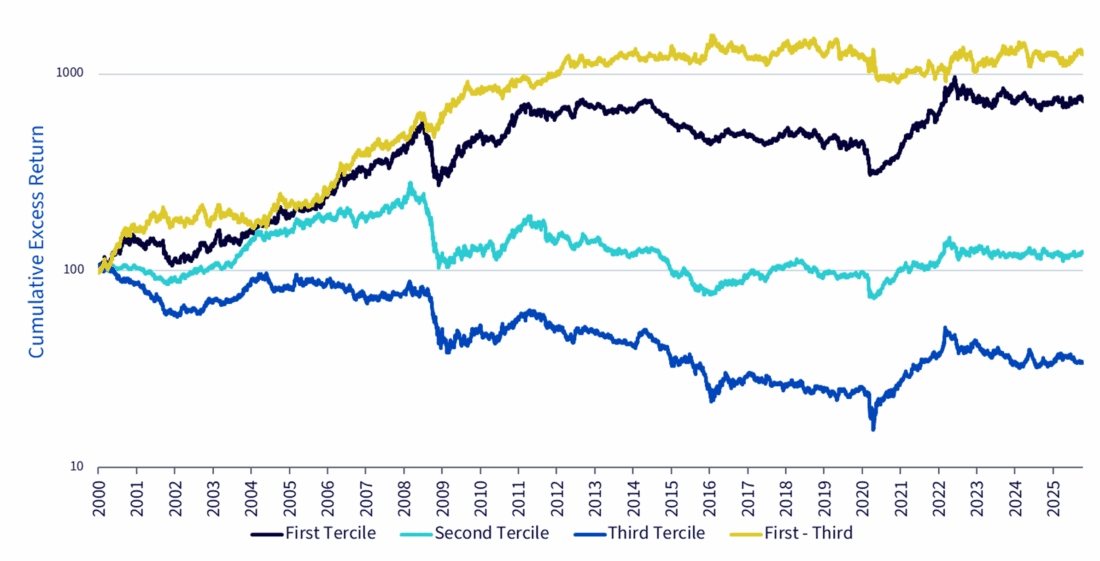
From 06/01/2001 to 21/10/2025. Source: WisdomTree, Bloomberg, Factset. Excess returns in USD. Includes backtested data for illustration purposes. Historical performance is not an indication of future performance, and any investments may go down in value.
One of the most famous investors to successfully use second-derivative thinking is Stanley Druckenmiller. Put simply, the second derivative shows how fast something is changing. It helps spot whether a trend is speeding up or slowing down, often before it’s visible in prices. In this context, carry measures the slope of the futures curve. It shows how steeply the curve is in backwardation or contango. Slope momentum measures how that slope is changing over time. It shows whether the curve is becoming steeper or flatter. This information is meaningful: while carry benefits from the persistence of a backwardated curve, slope momentum gains from a curve moving toward backwardation, which often reflects a tightening market.
We construct Slope Momentum as the smoothed, volatility-adjusted change in daily 12-month roll yield (calculated in the same way as we did for the Carry factor). The signal captures whether a commodity’s curve is moving towards backwardation (tightening) or towards contango (loosening). A positive signal indicates the curve is tilting into backwardation, while a negative signal indicates a tilt into contango.
Evidence shows that slope momentum performs well in both cross-sectional and time-series strategies. In the time-series approach shown below, commodities with positive slope momentum are held long, while those with negative slope momentum are held short.
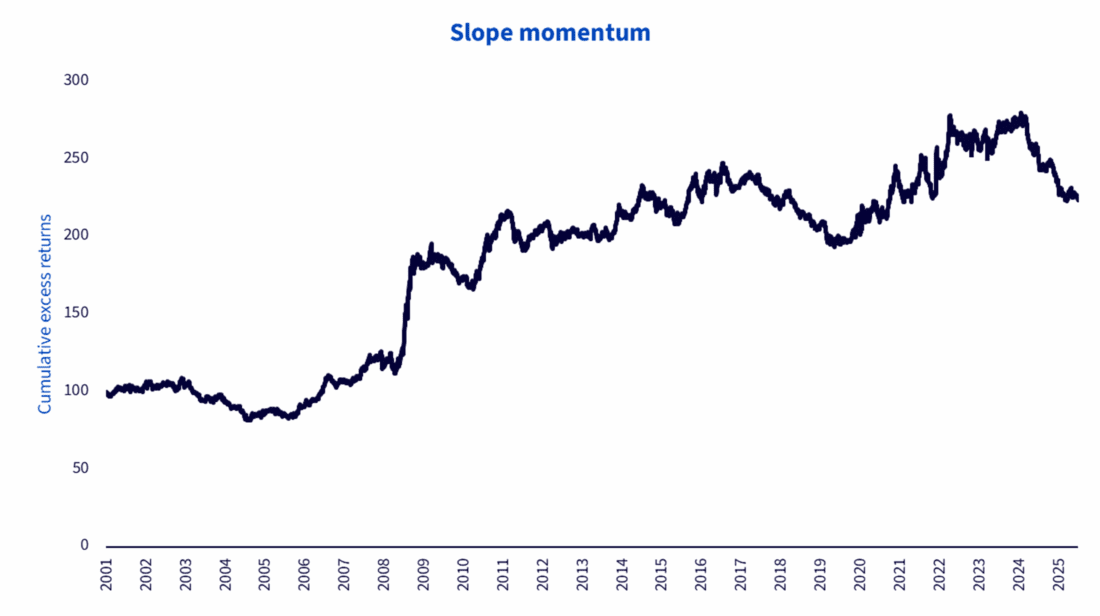
From 02/04/2001 to 21/10/2025. Source: WisdomTree, Bloomberg, Factset. Excess returns in USD. Includes backtested data for illustration purposes. Historical performance is not an indication of future performance, and any investments may go down in value.
In summary, the chart table shows the results obtained for the two factors:
Overall Carry and Slope Momentum results and statistical significance
| Model type | Model | Submodel | Periods | Annualized return | t-stat | p-value |
|---|---|---|---|---|---|---|
| Cross-sectional | Roll Yield | 12 months | 6727 | 5.21% | 2.75 | 0.60% |
| Cross-sectional | Roll Yield | Front | 6727 | 5.46% | 3.13 | 0.18% |
| Cross-sectional | Slope Momentum | – | 6652 | 4.28% | 2.51 | 1.19% |
| Time-series | Roll Yield | 12 months | 6035 | -0.62% | -0.28 | 78.03% |
| Time-series | Roll Yield | Front | 6098 | 3.26% | 1.88 | 5.99% |
| Time-series | Slope Momentum | – | 6035 | 3.78% | 2.03 | 4.24% |
Source: WisdomTree, Bloomberg, Factset. The table reports annualised returns, t-statistics, and p-values for each model and sub-model tested across both cross-sectional and time-series frameworks. The t-statistic measures how statistically different the observed returns are from zero—higher values indicate greater confidence that the factor’s performance is not due to random chance. The p-value represents the probability that the observed result occurred by chance; lower values imply stronger statistical significance. For comparability, the annualised returns for cross-sectional models are divided by two. Historical performance is not an indication of future performance, and any investments may go down in value.
When building a commodity strategy, choosing which commodities to overweight is only part of the process. The next key decision is which futures contracts to use, with many options available along the curve. Traditional indices such as BCOM and GSCI are positioned at the front of the curve. This provides strong liquidity and close exposure to spot price movements. However, it also comes with a cost. Sitting at the front of the curve typically means greater exposure to roll drag, which can steadily reduce returns over time. Our research shows that contract selection plays an important role. Choosing contracts further along the curve can deliver meaningful long-term improvements.
It is important to make a key distinction. Commodity futures curves generally fall into two categories: seasonal and non-seasonal. Seasonal commodities follow predictable cycles in supply or demand. These cycles are often linked to planting and harvest patterns or weather-related usage, such as heating and cooling. Their futures curves tend to show clear, calendar-based peaks and troughs that repeat over time. Non-seasonal commodities, by contrast, do not display these patterns. Due to their non-perishable nature or because they are easily storable (e.g., industrial metals), they do not exhibit any seasonality in their futures curve.
| Name | BCOM contract selection | Seasonal contract selection | Relative return | Relative volatility |
|---|---|---|---|---|
| RBOB Gasoline | 5.90% | 7.70% | 1.80% | -4.30% |
| ULS Diesel | 4.70% | 5.40% | 0.70% | -3.00% |
| HRW Wheat | -7.10% | -4.10% | 3.00% | -1.20% |
| SRW Wheat | -10.00% | -5.90% | 4.10% | -2.00% |
| Soybean | 4.80% | 6.50% | 1.70% | -1.00% |
| Corn | -6.50% | -4.80% | 1.70% | -1.60% |
| Cotton | -5.20% | -3.00% | 2.20% | -1.80% |
| Sugar | -0.30% | 2.20% | 2.50% | -3.40% |
| Lean Hogs | -9.30% | -1.20% | 8.10% | -3.60% |
| Live Cattle | -0.20% | 1.90% | 2.10% | -1.50% |
| Natural Gas | -24.50% | -13.90% | 10.60% | -8.20% |
| Soybean Oil | 0.90% | 2.30% | 1.40% | -0.80% |
| Soybean Meal | 8.10% | 9.90% | 1.80% | -1.20% |
From 25/01/2002 to 20/10/2025. Source: WisdomTree, Bloomberg. Excess returns in USD. Historical performance is not an indication of future performance, and any investments may go down in value.
For markets with predictable seasonal demand or supply patterns (natural gas, grains, softs), high roll yield often reflects seasonality rather than true tightness. Anchoring exposure to the seasonal contract, such as December for natural gas, systematically captures the seasonal hedging premium.
This approach improved returns across every seasonal market tested, with gains that go from 0.7% (on an annualised basis) to the tune of more than +10% (for natural gas), while reducing volatility.
| Name | BCOM contract selection | Max roll yield contract selection | Relative return | Relative volatility |
|---|---|---|---|---|
| WTI Crude | -1.90% | 5.30% | 7.20% | -5.50% |
| Brent Crude | 4.80% | 6.40% | 1.60% | -3.00% |
| Gasoil | 5.10% | 5.70% | 0.60% | -2.50% |
| Aluminium | -2.00% | -0.70% | 1.30% | -1.00% |
| Zinc | 0.90% | 2.70% | 1.90% | -0.90% |
| Lead | 5.30% | 6.00% | 0.70% | -0.90% |
| Nickel | 2.40% | 4.20% | 1.80% | -0.80% |
| Coffee | -5.70% | -4.40% | 1.30% | -1.60% |
| Copper | 5.50% | 7.00% | 1.50% | -0.70% |
From 03/01/2000 to 20/10/2025. Source: WisdomTree, Bloomberg. Excess returns in USD. Historical performance is not indicative of future results, and any investment may decline in value.
For metals, crude oils and other non-seasonal markets, the curve reflects inventories, cost of carry, and convenience yield. Here, we select the contract monthly, with terms up to nine months out, based on the highest implied roll yield (or the lowest implied roll drag). This reduces contango drag, lowers volatility and improves excess returns. All non-seasonal commodities benefited from this rule, with annualised improvements ranging from +0.6% to +7.2% and consistently lower volatility than front-month rolling.
Thales’ story is really about recognising where market tightness might emerge and acting early. We’re not claiming his kind of ‘wisdom’, and we’re indeed not forecasting harvests. Our approach is more straightforward: we try to extract the information already embedded in prices. Futures curves condense today’s market conditions and (to some extent) today’s expectations into a single object you can measure. Carry tells you where tightness is, slope momentum tells you where it’s going, and contract selection helps you avoid overpaying for exposure when the curve is working against you.
—
Originally Posted January 13, 2026 – Please mind the slope: why futures curves matter
1 The so-called Theory of Storage.
2 A curve is said to be in backwardation when near-dated contracts trade above longer-dated (deferred) contracts.
3 By converse, a curve is said to be in contango when near-dated contracts trade below longer-dated contracts.
This material is prepared by WisdomTree and its affiliates and is not intended to be relied upon as a forecast, research or investment advice, and is not a recommendation, offer or solicitation to buy or sell any securities or to adopt any investment strategy. The opinions expressed are as of the date of production and may change as subsequent conditions vary. The information and opinions contained in this material are derived from proprietary and non-proprietary sources. As such, no warranty of accuracy or reliability is given and no responsibility arising in any other way for errors and omissions (including responsibility to any person by reason of negligence) is accepted by WisdomTree, nor any affiliate, nor any of their officers, employees or agents. Reliance upon information in this material is at the sole discretion of the reader. Past performance is not a reliable indicator of future performance.
Please click here for our full disclaimer.
Jurisdictions in the European Economic Area (“EEA”): This content has been provided by WisdomTree Ireland Limited, which is authorised and regulated by the Central Bank of Ireland.
Jurisdictions outside of the EEA: This content has been provided by WisdomTree UK Limited, which is authorised and regulated by the United Kingdom Financial Conduct Authority.
Information posted on IBKR Campus that is provided by third-parties does NOT constitute a recommendation that you should contract for the services of that third party. Third-party participants who contribute to IBKR Campus are independent of Interactive Brokers and Interactive Brokers does not make any representations or warranties concerning the services offered, their past or future performance, or the accuracy of the information provided by the third party. Past performance is no guarantee of future results.
This material is from WisdomTree Europe and is being posted with its permission. The views expressed in this material are solely those of the author and/or WisdomTree Europe and Interactive Brokers is not endorsing or recommending any investment or trading discussed in the material. This material is not and should not be construed as an offer to buy or sell any security. It should not be construed as research or investment advice or a recommendation to buy, sell or hold any security or commodity. This material does not and is not intended to take into account the particular financial conditions, investment objectives or requirements of individual customers. Before acting on this material, you should consider whether it is suitable for your particular circumstances and, as necessary, seek professional advice.
Futures are not suitable for all investors. The amount you may lose may be greater than your initial investment. Before trading futures, please read the CFTC Risk Disclosure. A copy and additional information are available at ibkr.com.


Join The Conversation
For specific platform feedback and suggestions, please submit it directly to our team using these instructions.
If you have an account-specific question or concern, please reach out to Client Services.
We encourage you to look through our FAQs before posting. Your question may already be covered!