
- Solve real problems with our hands-on interface
- Progress from basic puts and calls to advanced strategies
Interactive Options Course

Posted May 19, 2026 at 12:42 pm
The 30-year bond yield leaped to its highest level going back to 2007 this morning, just shy of 5.20%, as an unresolved Middle East conflict threatens to further propel costs and fiscal expenditures across global economies. Rates had behaved in tempered fashion since the beginning of the war in February, rising notably but in a controlled, rather than wild, manner, as fixed-income watchers viewed the geopolitical confrontation as contributing to a short-lived, one-time energy shock. However, now that the hostilities have extended for almost a third full month, inflationary forces are spreading throughout all areas of the landscape, with accelerating services, food and goods charges pushing price pressures well above central bank targets, and in some cases, over double. The tightening financial conditions are weighing heavily on equities, which are suffering a third consecutive day of losses, as a 55% chance of a Federal Reserve hike in 2026 catch stock and Treasury bulls by surprise. It’s certainly been quite the U-turn, in consideration of a year which started off with the curve pricing in several cuts, not increases. In trading, tech and small caps are leading the way south, as every major domestic benchmark retreats on the session with investors scooping up volatility protection instruments in case there’s more turbulence in the near future. Non-energy commodities and cryptocurrencies are sinking on softening speculative enthusiasms and weakening monetary policy easing prospects, which are strengthening the greenback. Elsewhere, prediction markets are catching bids.
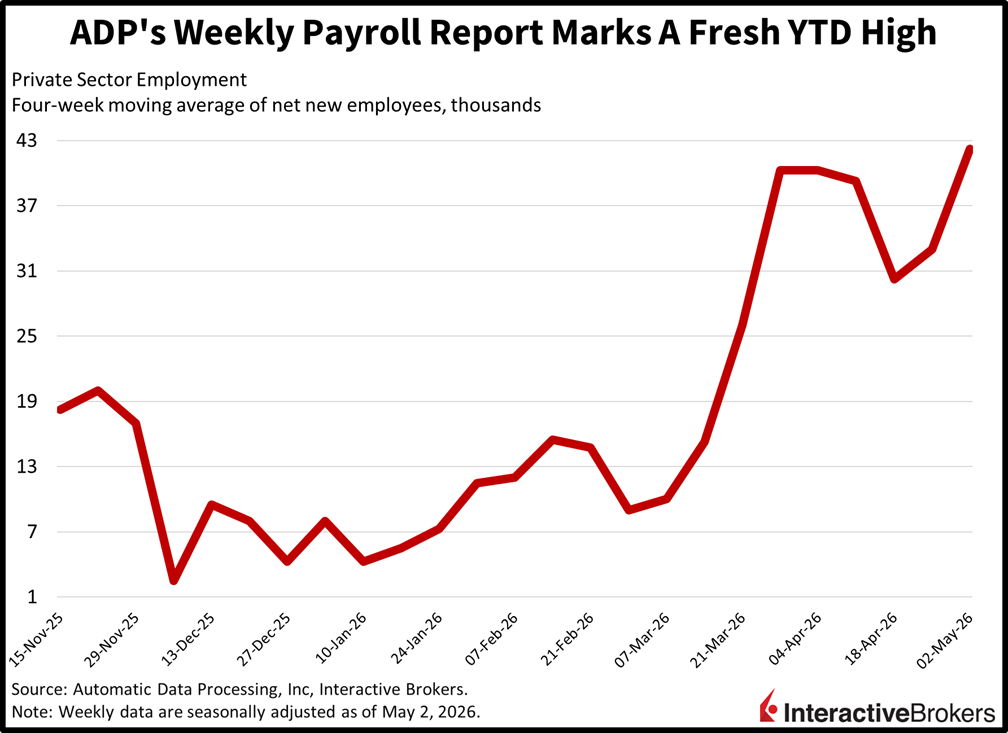
Private sector hiring accelerated to its fastest pace of the year near the beginning of this month, as firm demand for labor supports consumer spending, economic growth and loftier interest rates. Worker rosters rose by an average of 42.25k employees in each of the four weeks during the period that ended May 2, stronger than the 33k figure from the prior print, according to ADP. The continuation of robust payroll trends is adding further credence to the notion that the Fed should prioritize the inflation side of its mandate rather than unemployment at this juncture.
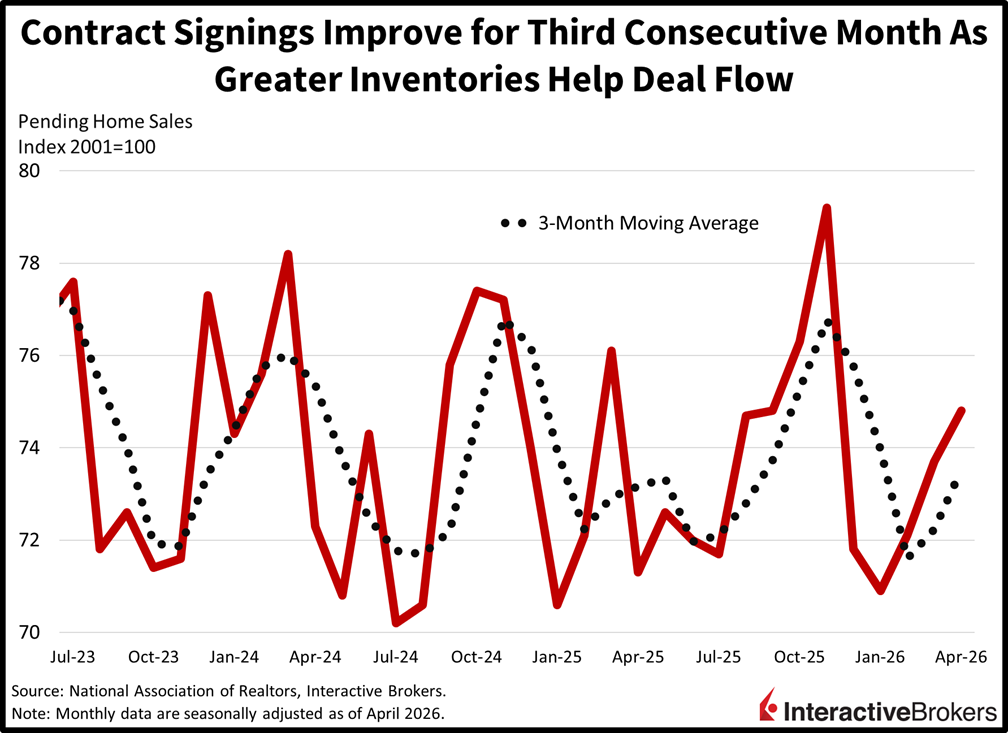
A third consecutive monthly lift in pending home sales occurred as greater inventories brought prospective buyers into the market last month. The 1.4% month-over-month (m/m) expansion beat the expectation calling for a 1% rise but slowed from March’s 1.7%. The improving performance also flipped the annualized measure positive, as a 1.1% year-over year (y/y) contraction in the previous print turned into a 3.2% increase in this morning’s publication. All regions contributed, with the Northeast, Midwest, South and West seeing m/m climbs of 6.6%, 3%, 0.7% and 0.4%. Contract signings serve as a leading indicator to closings, as transactions are typically finalized 30 to 60 days afterwards, as financing terms, inspection processes and residential inspections are completed.
Quite simply, the economy can’t sustainably handle interest rates that are this high at the long end of the Treasury curve as it poses too heavy a constraint on activity, consumption, investment and risk appetite. Slowdown concerns are poised to manifest as the 10-year inches closer to 5% and if and when the data weaken as a result of elevated credit costs, then capital gains on duration are set to be stellar. Indeed, inflationary worries can be replaced by recession angst if borrowing charges remain this lofty, and that’s bound to plunge yields from the 5- to 30-year instruments across the compound of government debt assets. For this reason, fixed-income investors that were sheltering in T-bills may now incrementally begin extending the maturity profiles of their portfolios by nibbling on duration. The belly of the complex out to the final edge can certainly continue ascending from here; however, it has another 25 basis points of runway north before falling aggressively in my view.
Canada’s April Consumer Price Index posted 2.8% and 0.4% y/y and m/m increases compared to the economist consensus estimates of 3.1% and 0.7%. The annual pace accelerated from 2.4% in the preceding period but the m/m metric eased from 0.9%. Within the m/m gauge, higher fuel costs contributed to the transportation category, with a 1.8% hike, having the largest gain. Clothing and footwear became 1% more expensive. The shelter classification, the recreation, education and reading group and category consisting of health and personal care each climbed 0.1%. The alcoholic beverages, tobacco products and recreational cannabis category and the food group were unchanged.
Canada’s New Housing Price Index sank 0.4% m/m in April after falling 0.2% in March. Economists anticipated no price change. With the exception of February’s 0.3% gain, new home prices have either been unchanged or have sunk in every month since February 2025, when acquiring a home cost 0.1% more m/m.
Japan’s gross domestic product (GDP) grew 2.1% y/y and 0.5% quarter over quarter (q/q) during the first three months of this year, a considerable acceleration from the 0.8% and 0.2% expansion in the final quarter of 2025. The result was also more vibrant than the economist consensus estimates for y/y and m/m expansions of 1.7% and 0.4%. The q/q rate of capital expenditures fell from 1.4% hike in the fourth quarter to 0.3%, just 0.1 percentage point above the consensus estimate; however, private consumption was up 0.3% after posting no change in the last three months of 2025. The print narrowly exceeded the economist consensus estimate of 0.2%. External demand also improved. Its 0.3% growth exceeded both the 0.2% estimate and the fourth quarter’s goose egg print.
Japan’s first quarter ended with its final month posting 1.2% and 0.4% m/m declines in capacity utilization and industrial production. The fall in capacity utilization steepened from the 0.1% February contraction but the industrial production weakness eased from the 2% slip in the preceding month.
The UK unemployment rate was 5% in March, a 0.1 percentage point ascent from February and above the 4.9% economist consensus estimate. With the exception of the February level, the rate is lower than any month since October, when it matched the current print. Workers ended the quarter with average earnings ex-bonus and average earnings including bonuses up 3.4% and 4.1% y/y. The ex-bonus print matched the economist consensus forecast but slowed from 3.6% in February. Compensation including bonuses, conversely, exceeded the estimate of 3.8% and February’s 3.9% rise.
Information posted on IBKR Campus that is provided by third-parties does NOT constitute a recommendation that you should contract for the services of that third party. Third-party participants who contribute to IBKR Campus are independent of Interactive Brokers and Interactive Brokers does not make any representations or warranties concerning the services offered, their past or future performance, or the accuracy of the information provided by the third party. Past performance is no guarantee of future results.
This material is from IBKR Macroeconomics, an affiliate of Interactive Brokers LLC, and is being posted with its permission. The views expressed in this material are solely those of the author and/or IBKR Macroeconomics and Interactive Brokers is not endorsing or recommending any investment or trading discussed in the material. This material is not and should not be construed as an offer to buy or sell any security. It should not be construed as research or investment advice or a recommendation to buy, sell or hold any security or commodity. This material does not and is not intended to take into account the particular financial conditions, investment objectives or requirements of individual customers. Before acting on this material, you should consider whether it is suitable for your particular circumstances and, as necessary, seek professional advice.
Futures, event contracts, and forecast contracts are not suitable for all investors. Before trading these products, please read the CFTC Risk Disclosure. For a copy, visit our Warnings and Disclosures Page.
Trading in digital assets, including cryptocurrencies, is especially risky and is only for individuals with a high risk tolerance and the financial ability to sustain losses. Eligibility to trade in digital asset products may vary based on jurisdiction.
For specific platform feedback and suggestions, please submit it directly to our team using these instructions.
If you have an account-specific question or concern, please reach out to Client Services.
We encourage you to look through our FAQs before posting. Your question may already be covered!
Related Articles


Jose, it’ll be interesting to watch how policy evolves now that rate hikes are back on the table for 2026.