
- Solve real problems with our hands-on interface
- Progress from basic puts and calls to advanced strategies
Interactive Options Course

Posted February 3, 2026 at 10:15 am
Preferreds, which offer income potential, are securities that are generally considered hybrid investments, meaning they share characteristics of both stocks and bonds. They can offer more predictable income than do common stocks and are typically rated by the major credit rating agencies. Yet, because preferred shareholders have lower priority in the capital structure compared to bondholders, the ratings on preferred shares are generally lower than on the same issuers’ bonds. Although, the yields on preferreds typically are above those of same issuers’ bonds to account for the higher credit risk.
The designation “preferred” refers to the security’s treatment relative to common shareholders. Preferred stocks dividends typically have priority over common equity dividends. Preferred securities usually have long maturities or are perpetual with no maturity at all. There are two types of preferreds stock: cumulative and non-cumulative. Non-cumulative preferred stock does not repay unpaid or omitted dividends while cumulative preferred stock entitles investors to missed dividends. If a company with cumulative preferred stock suspends its dividend, these forgone dividends accumulate and must eventually be paid to preferred shareholders.
Companies may issue preferreds for a variety of reasons:
Preferred securities can have a variety of different coupon structures:
If they contain a call feature, preferreds may be called by the issuer after a certain date. The motivation for the redemption is generally the same as for bonds: a company calls in securities that pay higher rates than what the market is currently offering. While some preferreds see refinancing with lower interest rates, many preferreds with high coupon rates remain outstanding, trading above their call prices for years due to a variety of factors that may impede the issuers from refinancing.
Some preferred shares are convertible preferred stocks that include an option for the holder to convert the shares into a fixed number of common shares after a predetermined date. More often than not, this feature is not at the election of the holder and is instead mandatory. Mandatory convertible preferreds automatically convert to common equity on or before a predetermined date, and therefore may behave in a more equity-like fashion than other preferred security types. The value of a convertible preferred stock is ultimately based on the performance of the common stock.
The case for preferreds and the role they can play as a diversified income generator within portfolios, is centered on four key aspects:
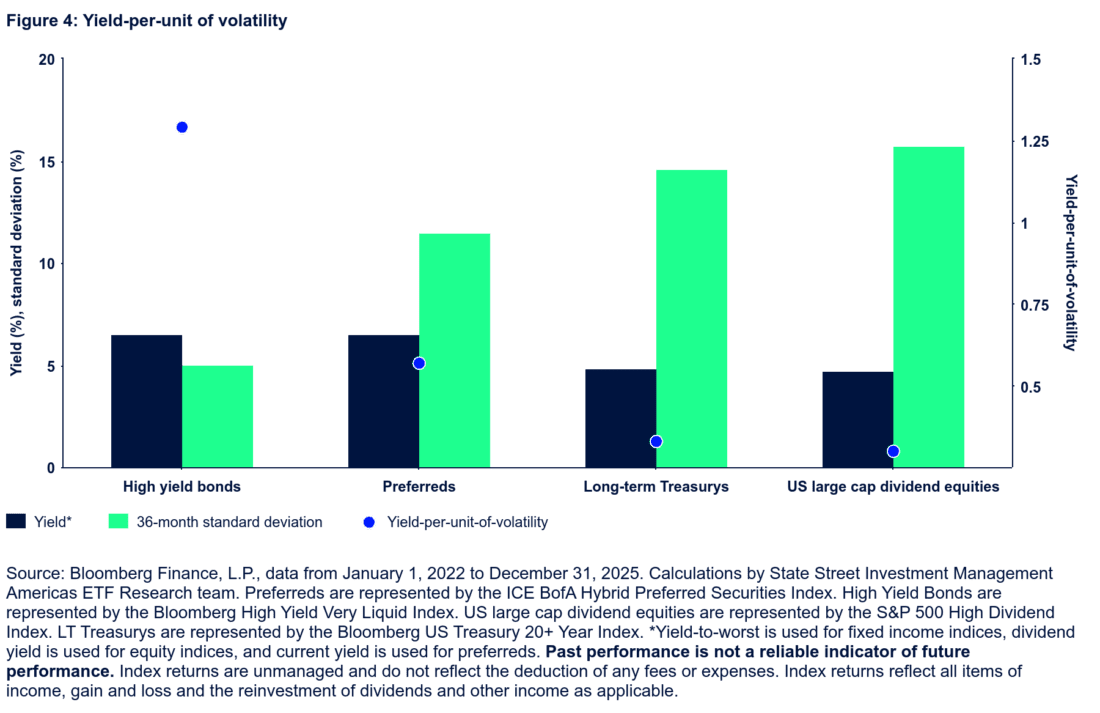
If yield is a key reason to consider preferreds, how does the asset class stack up against other income-generating choices? Preferreds compare favorably to dividend paying stocks, investment-grade corporate bonds, and the broader bond market (Figure 1). While they may have a similar yield to high yield bonds, it’s worth pointing out that the index representing preferreds shown below is all investment-grade rated.1 While the ICE BofA Hybrid Preferred Securities Index consists entirely of investment-grade rated securities, it is important to note that not all preferred stocks are rated by ratings agencies.

End of interactive chart.
Key takeaway: A potential 6%+ yield for a group of primarily investment-grade securities is worth considering for the income generation portion of a portfolio.
Beyond an attractive yield potential, many preferred securities pay qualified dividend income (QDI) rates, which may enhance after-tax yield. Taxed at roughly 20%, QDI rates can be considerably less than ordinary income rates. Since preferred securities are hybrids of stocks and bonds, certain preferred securities generate qualified dividend income. This type of income is typically created by common stocks and taxed at the lower capital gains tax rate. In contrast, traditional fixed income investments create income subject to ordinary income tax rates (up to 37% based on current tax brackets).2
One of the basic principles of portfolio construction is ensuring portfolios are properly diversified, seeking to balance risk and return by including assets with low correlations. A way to examine the potential diversification benefits of an asset class, and its use case, is to understand its correlation profile. For instance, if a fixed income exposure has a low correlation to other bond strategies but is highly correlated with equities, than its inclusion into the fixed income sleeve of a standard 60/40 equity/bond allocation may do two things:
If that is the intended goal, inclusion could be a good idea. In any case, understanding the cross-asset correlation profile of an exposure prior to implementation should be on the investor’s portfolio construction checklist. For preferreds, as they are both bond-and stock-like, their correlation profile is low relative to both asset classes, as shown below. Their correlation long-term to US Treasurys is at 0.39 over the last 15 years (based on monthly returns).3 They also have lower than a 0.65 correlation to equity-sensitive high yield bonds and to equities themselves—from all parts of the world.4
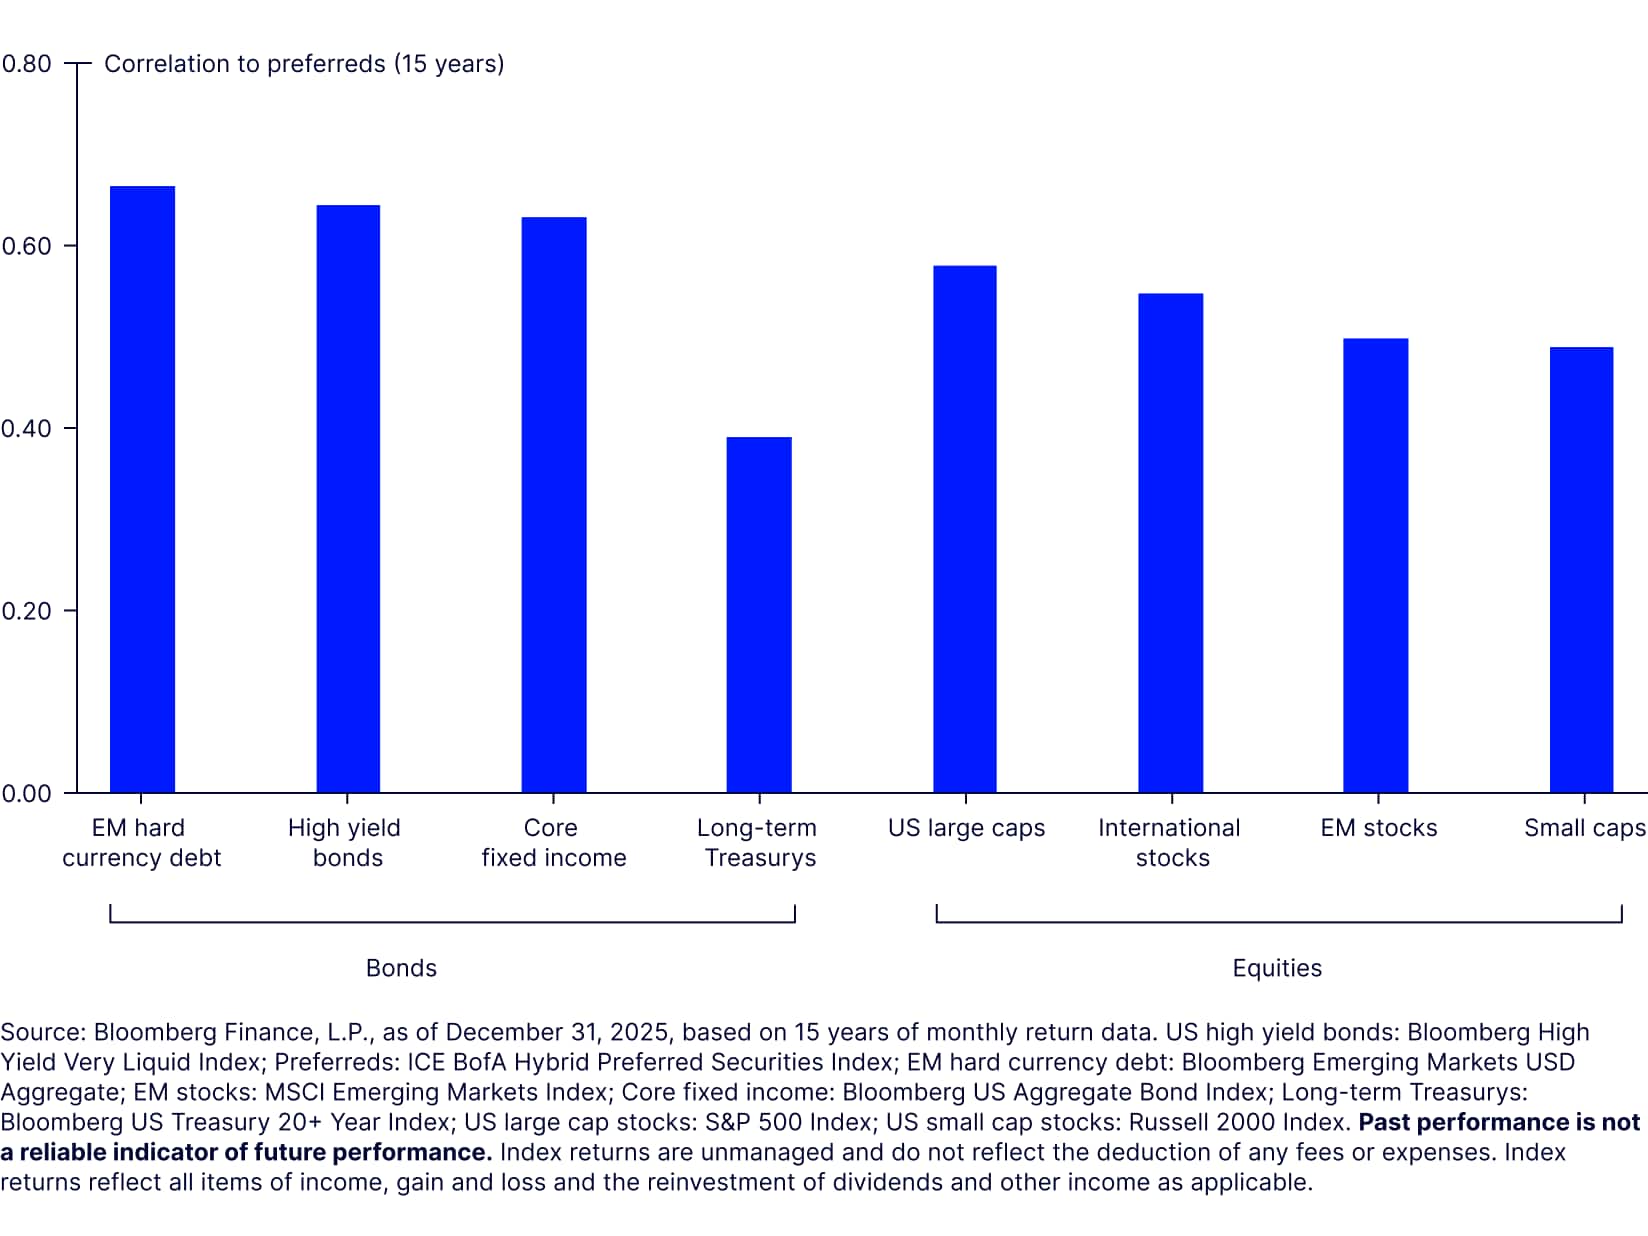
Key takeaway: Preferred shares have low historical correlations to traditional stocks and bonds, indicating that their return patterns may be differentiated throughout certain market environments, resulting in a potential portfolio diversifier.
As a result of preferred shares having both bond and stock-like features, the volatility profile of preferreds has historically been lower than that of pure common stocks, while being just a touch below that of credit-sensitive high yield bonds, as shown below. For this analysis, we used the historical median rolling 36-month standard deviation of returns over the last 15 years, as a rolling measure can account for the cyclicality within an asset class. It is also more constructive than periodic returns, as one can examine outliers. For instance, preferred shares became more volatile than both high yields bonds and US large-cap stocks during the financial crisis due to the financial concentration within the asset class.5 The latter point may be helpful in understanding return patterns if there is a market event that creates short-term volatility in the financial sector.
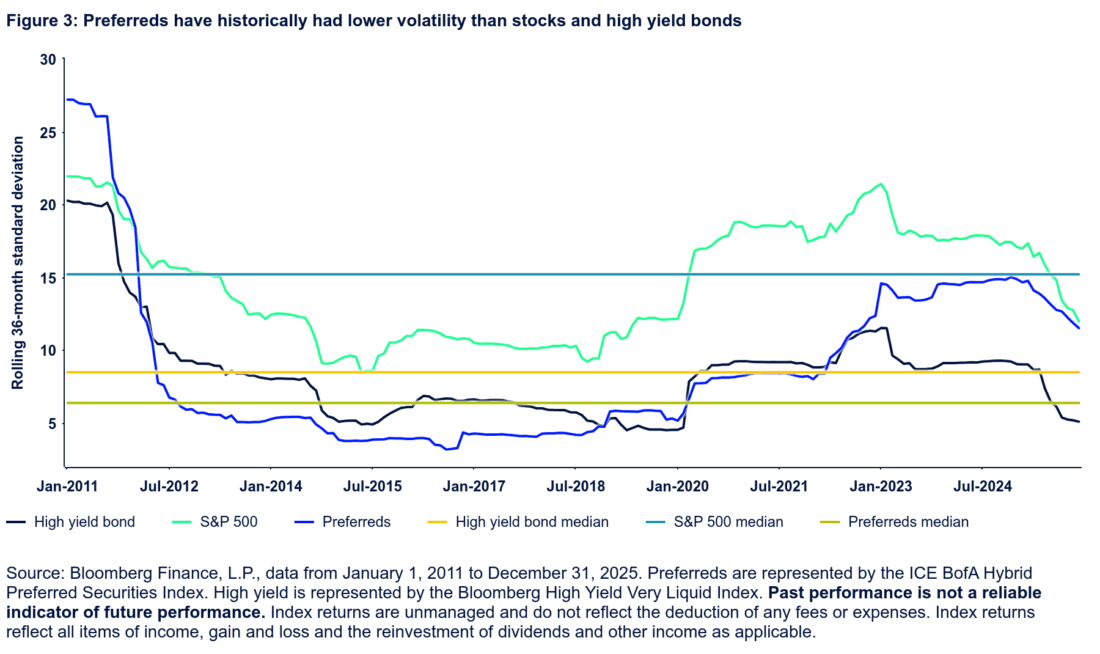
Key takeaway: Due to the hybrid nature of preferred shares, the volatility profile is lower than that of common stocks—both traditional US large caps and the actual underlying common stocks of the same preferreds—and credit-sensitive high yield bonds. Therefore, preferreds add high income potential without taking on outsized volatility.
Preferreds may be an option for investors seeking some of the highest yields in the investment-grade universe while maintaining overall portfolio diversification.
Due to the unique features described earlier, investors can integrate preferreds into their portfolios with these goals in mind:
—
Originally Posted on January 30, 2026 – Preferred securities: What they are and how they work
Do not reproduce or reprint without the written permission of SSGA.
All information has been obtained from sources believed to be reliable, but its accuracy is not guaranteed. There is no representation or warranty as to the current accuracy, reliability or completeness of, nor liability for, decisions based on such information and it should not be relied on as such.
State Street Global Advisors and its affiliates (“SSGA”) have not taken into consideration the circumstances of any particular investor in producing this material and are not making an investment recommendation or acting in fiduciary capacity in connection with the provision of the information contained herein.
ETFs trade like stocks, are subject to investment risk, fluctuate in market value and may trade at prices above or below the ETF’s net asset value. Brokerage commissions and ETF expenses will reduce returns.
Bonds generally present less short-term risk and volatility than stocks, but contain interest rate risk (as interest rates raise, bond prices usually fall); issuer default risk; issuer credit risk; liquidity risk; and inflation risk. These effects are usually pronounced for longer-term securities. Any fixed income security sold or redeemed prior to maturity may be subject to a substantial gain or loss.
Investing involves risk including the risk of loss of principal.
The whole or any part of this work may not be reproduced, copied or transmitted or any of its contents disclosed to third parties without SSGA’s express written consent.
Investing in high yield fixed income securities, otherwise known as “junk bonds”, is considered speculative and involves greater risk of loss of principal and interest than investing in investment grade fixed income securities. These Lower-quality debt securities involve greater risk of default or price changes due to potential changes in the credit quality of the issuer.
COPYRIGHT AND OTHER RIGHTS
Other third party content is the intellectual property of the respective third party and all rights are reserved to them. All rights reserved. No organization or individual is permitted to reproduce, distribute or otherwise use the statistics and information in this report without the written agreement of the copyright owners.
Definition:
Arbitrage: the simultaneous buying and selling of securities, currency, or commodities in different markets or in derivative forms in order to take advantage of differing prices for the same asset.
Fund Objectives:
SPY: The investment seeks to provide investment results that, before expenses, correspond generally to the price and yield performance of the S&P 500® Index. The Trust seeks to achieve its investment objective by holding a portfolio of the common stocks that are included in the index (the “Portfolio”), with the weight of each stock in the Portfolio substantially corresponding to the weight of such stock in the index.
VOO: The investment seeks to track the performance of a benchmark index that measures the investment return of large-capitalization stocks. The fund employs an indexing investment approach designed to track the performance of the Standard & Poor’s 500 Index, a widely recognized benchmark of U.S. stock market performance that is dominated by the stocks of large U.S. companies. The advisor attempts to replicate the target index by investing all, or substantially all, of its assets in the stocks that make up the index, holding each stock in approximately the same proportion as its weighting in the index.
IVV: The investment seeks to track the investment results of the S&P 500 (the “underlying index”), which measures the performance of the large-capitalization sector of the U.S. equity market. The fund generally invests at least 90% of its assets in securities of the underlying index and in depositary receipts representing securities of the underlying index. It may invest the remainder of its assets in certain futures, options and swap contracts, cash and cash equivalents, as well as in securities not included in the underlying index, but which the advisor believes will help the fund track the underlying index.
The funds presented herein have different investment objectives, costs and expenses. Each fund is managed by a different investment firm, and the performance of each fund will necessarily depend on the ability of their respective managers to select portfolio investments. These differences, among others, may result in significant disparity in the funds’ portfolio assets and performance. For further information on the funds, please review their respective prospectuses.
Entity Disclosures:
The trademarks and service marks referenced herein are the property of their respective owners. Third party data providers make no warranties or representations of any kind relating to the accuracy, completeness or timeliness of the data and have no liability for damages of any kind relating to the use of such data.
SSGA Funds Management, Inc. serves as the investment advisor to the SPDR ETFs that are registered with the United States Securities and Exchange Commission under the Investment Company Act of 1940. SSGA Funds Management, Inc. is an affiliate of State Street Global Advisors Limited.
Intellectual Property Disclosures:
Standard & Poor’s®, S&P® and SPDR® are registered trademarks of Standard & Poor’s® Financial Services LLC (S&P); Dow Jones is a registered trademark of Dow Jones Trademark Holdings LLC (Dow Jones); and these trademarks have been licensed for use by S&P Dow Jones Indices LLC (SPDJI) and sublicensed for certain purposes by State Street Corporation. State Street Corporation’s financial products are not sponsored, endorsed, sold or promoted by SPDJI, Dow Jones, S&P, their respective affiliates and third party licensors and none of such parties make any representation regarding the advisability of investing in such product(s) nor do they have any liability in relation thereto, including for any errors, omissions, or interruptions of any index.
BLOOMBERG®, a trademark and service mark of Bloomberg Finance, L.P. and its affiliates, and BARCLAYS®, a trademark and service mark of Barclays Bank Plc., have each been licensed for use in connection with the listing and trading of the SPDR Bloomberg Barclays ETFs.
Distributor: State Street Global Advisors Funds Distributors, LLC, member FINRA, SIPC, an indirect wholly owned subsidiary of State Street Corporation. References to State Street may include State Street Corporation and its affiliates. Certain State Street affiliates provide services and receive fees from the SPDR ETFs.
ALPS Distributors, Inc., member FINRA, is distributor for SPDR® S&P 500®, SPDR® S&P MidCap 400® and SPDR® Dow Jones Industrial Average, all unit investment trusts. ALPS Distributors, Inc. is not affiliated with State Street Global Advisors Funds Distributors, LLC.
Before investing, consider the funds’ investment objectives, risks, charges, and expenses. For SPDR funds, you may obtain a prospectus or summary prospectus containing this and other information by calling 1‐866‐787‐2257 or visiting www.spdrs.com. Please read the prospectus carefully before investing.
Information posted on IBKR Campus that is provided by third-parties does NOT constitute a recommendation that you should contract for the services of that third party. Third-party participants who contribute to IBKR Campus are independent of Interactive Brokers and Interactive Brokers does not make any representations or warranties concerning the services offered, their past or future performance, or the accuracy of the information provided by the third party. Past performance is no guarantee of future results.
This material is from State Street Global Advisors and is being posted with its permission. The views expressed in this material are solely those of the author and/or State Street Global Advisors and Interactive Brokers is not endorsing or recommending any investment or trading discussed in the material. This material is not and should not be construed as an offer to buy or sell any security. It should not be construed as research or investment advice or a recommendation to buy, sell or hold any security or commodity. This material does not and is not intended to take into account the particular financial conditions, investment objectives or requirements of individual customers. Before acting on this material, you should consider whether it is suitable for your particular circumstances and, as necessary, seek professional advice.
Related Articles


Join The Conversation
For specific platform feedback and suggestions, please submit it directly to our team using these instructions.
If you have an account-specific question or concern, please reach out to Client Services.
We encourage you to look through our FAQs before posting. Your question may already be covered!