
- Solve real problems with our hands-on interface
- Progress from basic puts and calls to advanced strategies
Interactive Options Course

Posted August 18, 2026 at 9:30 am
A detailed daily look at some of the most interesting weather and climate prediction markets at ForecastEx and elsewhere.
Below is a scorecard for the daily temperature forecasts as they stood at 5:00 PM ET on Saturday, August 15th for the target day of Sunday, August 16th. The highs, the lows and the degree days are shown as separate grids below. Each grid below orders its cities by mean absolute error (MAE) for that metric, which is the average size of the miss, ignoring whether it was too warm or too cold, from largest to smallest.
ForecastEx is scored against eleven public forecast tools throughout this letter, all listed with links in the FAQ at the end. The grids below pull out four canonical tools for illustration: the American model, the European model, the National Weather Service, and the Aviation Forecast.

The largest errors on Sunday were in Seattle, where the five systems averaged 4.1°F on the high and every system in the grid above was too warm. The other large errors were spread across the East and the southern Plains rather than concentrated in one region.
Postmortem on the Seattle miss. The high reached 75°F in Seattle, whereas every system in the grid above was too warm, with the American model 10 degrees warmer and the European model 5 degrees warmer. On Saturday, the National Weather Service office in Seattle wrote that marine stratus had marched well inland from the coast into Puget Sound and would remain in place before gradually burning off into the afternoon. The stratus held longer than that, with broken or overcast cloud below 10,000 feet in seven of the ten daytime observations and no clearer sky until 3:53 PM, so the temperature climbed late and did not reach its 75°F high until 4:53 PM (black observed line below, well beneath the forecast levels drawn across it).
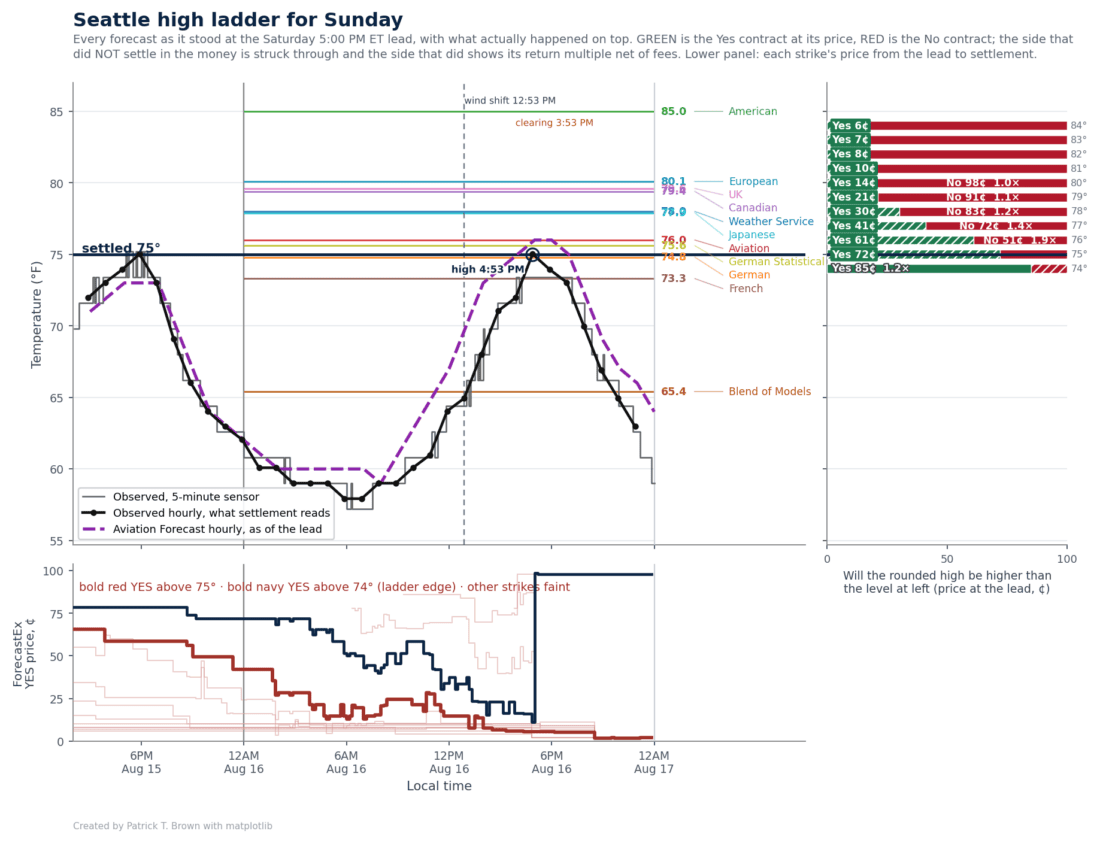

The feature described above occurred after the daily low was recorded and thus did not affect the low forecast skill. This is apparent in the grid above, where the Seattle MAE was only 1.2°F
Forecast skill in daily highs and lows corresponds directly to forecast skill in metrics called “cooling degree days” and “heating degree days” used extensively in the energy industry. These metrics measure deviations from daily average temperatures (average of the high and low for the day) of 65°F and reflect that people tend to activate their air conditioners when daily averages exceed 65°F (cooling degree days) and switch on their heat when daily averages fall below 65°F (heating degree days).
The range of plausible next-day temperature outcomes can translate into millions of dollars in differences in energy expenditure, and many organizations make day-ahead decisions based on cooling degree and heating degree day forecasts.

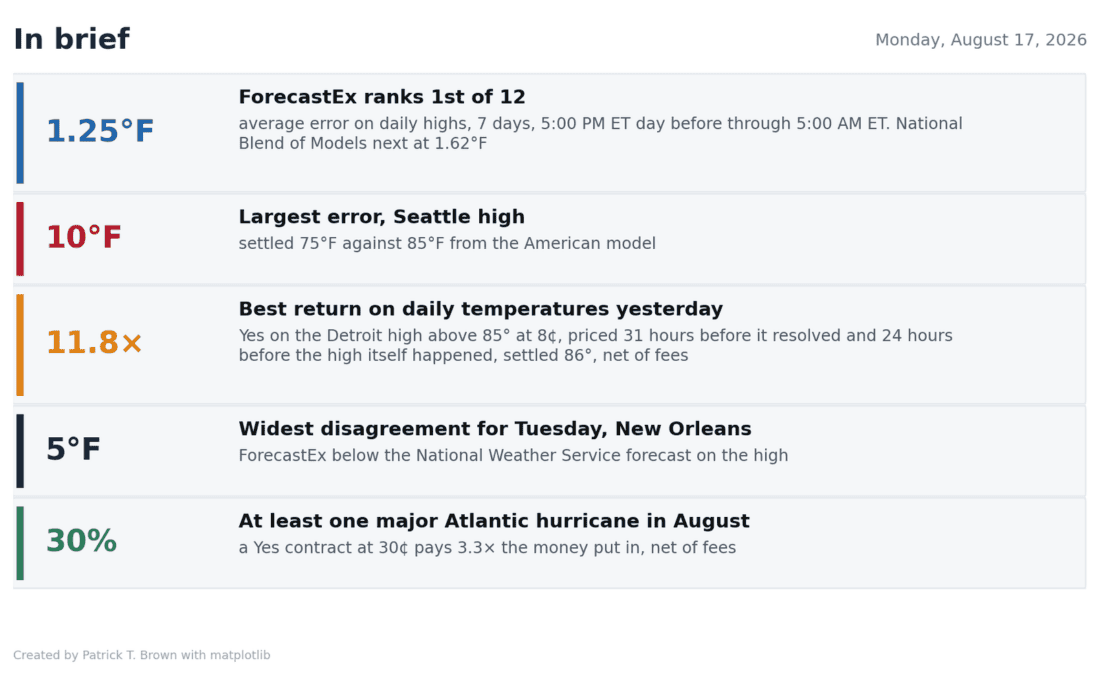
Oklahoma City led the degree-day errors at 2.8 cooling degree days, and ForecastEx’s implied degree days came first of the five systems at 0.90, ahead of the Aviation Forecast at 1.02.
The standings below measure overall forecast accuracy, indicating that ForecastEx has been the most accurate tool of the 12 publicly available tools tracked here over the past 7 days.
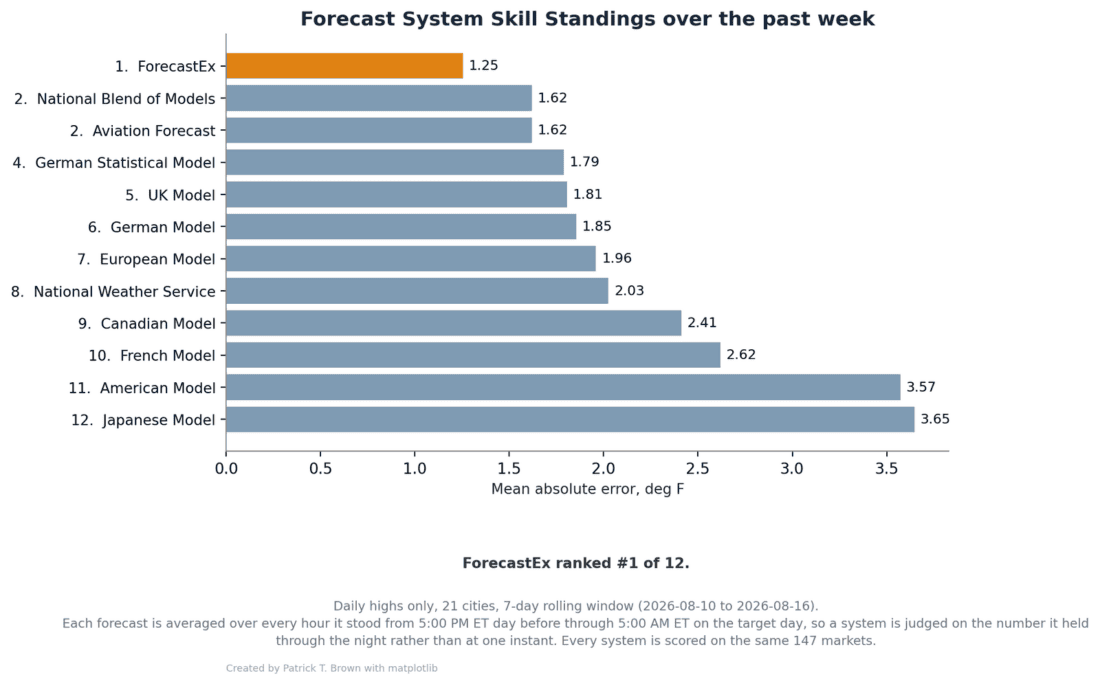
This constitutes ongoing evidence that weather prediction markets like ForecastEx may be the most accurate short-range weather forecasts available, and the difference becomes greater as lead time decreases.
Daily weather forecasting is one of the most mature, established, and scientifically principled fields of science and industry. It is not an exaggeration to describe conventional weather forecasting systems as the frontier of applied physics, statistics, and computer science, resting on decades, if not centuries, of scientific inquiry.
As such, conventional weather forecasts should hardly represent a target ripe for a novel forecasting system to improve upon. Despite the formidable challenge, ForecastEx prediction markets seem to be doing just that, not just echoing public forecasts but aggregating dispersed information in a way that improves upon sophisticated established systems.
This is possible because prediction markets are not substitutes for standard forecasts but rather sit downstream of them. They incorporate conventional forecast information as an input and convert it into refined probabilities through direct financial rewards for accuracy and direct financial penalties for inaccuracy. This creates a dual effect of attracting accurate individuals and systems into the market while deterring those who are inaccurate. People or systems that consistently make poor forecasts are heavily motivated to either improve or leave the market.
This improvement in accuracy is valuable for a variety of reasons. For example, wholesale electricity is bought and sold a day ahead in regional markets run by grid operators, with prices settling at benchmark trading hubs within each region, and the primary cause of daily variations in electricity demand and prices is variations in temperature.
Improving forecast accuracy is critical, but just as critically, if not more so, the structure of these contracts allows for direct hedges for industries exposed to high prices. Buying Yes contracts on lower-probability temperature extremes entails disproportionately large return multiples that would compensate for the associated disproportionately large electricity price spikes.
On average, no public tool beats ForecastEx consistently, but the trade board below asks the narrower question of where a single tool could potentially be used to identify edge in particular circumstances.
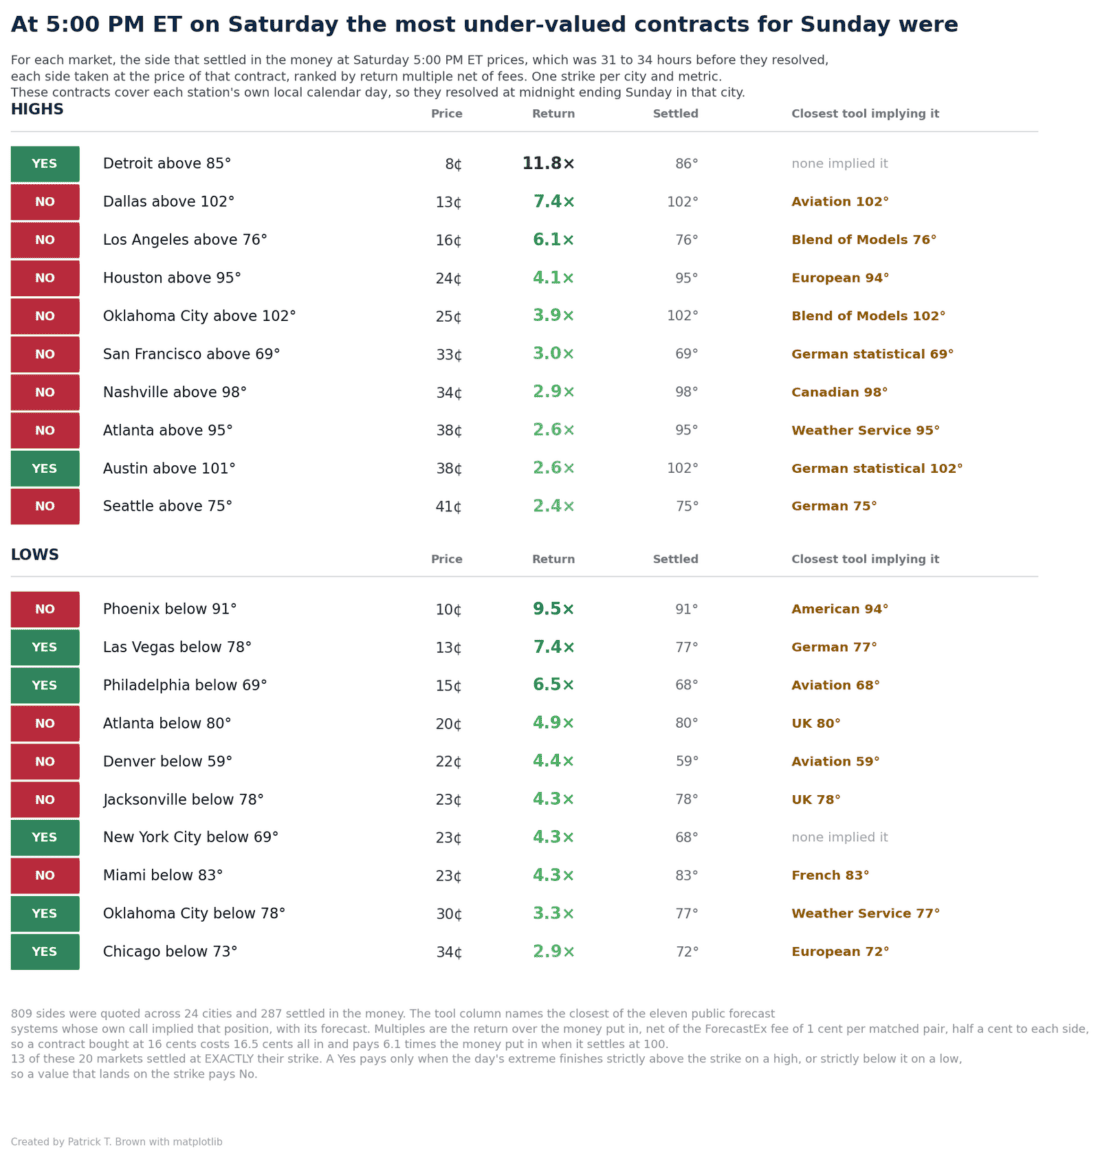
The most undervalued contract above was Yes on the Detroit high above 85 degrees, 8 cents 31 hours before it resolved and 24 hours before the high itself arrived at 4:38 PM, for an 11.8 times return net of fees. The twenty most undervalued contracts ran 13 to 7 in favor of No positions, and the Aviation Forecast was the closest public tool on three of them, more than any other system.

The widest gap on the map above is the New Orleans high, where ForecastEx sits 5.2°F below the National Digital Forecast Database, the United States government’s official public forecast behind weather.gov, produced by National Weather Service forecasters. The disagreements split by metric. On the highs ForecastEx is cooler than the National Weather Service at most cities on the map above, by 3.6°F in Nashville and 2.4°F in Los Angeles, with San Francisco the largest exception at 3.4°F warmer. On the lows the largest gap is Charlotte, where ForecastEx sits 3.3°F warmer.
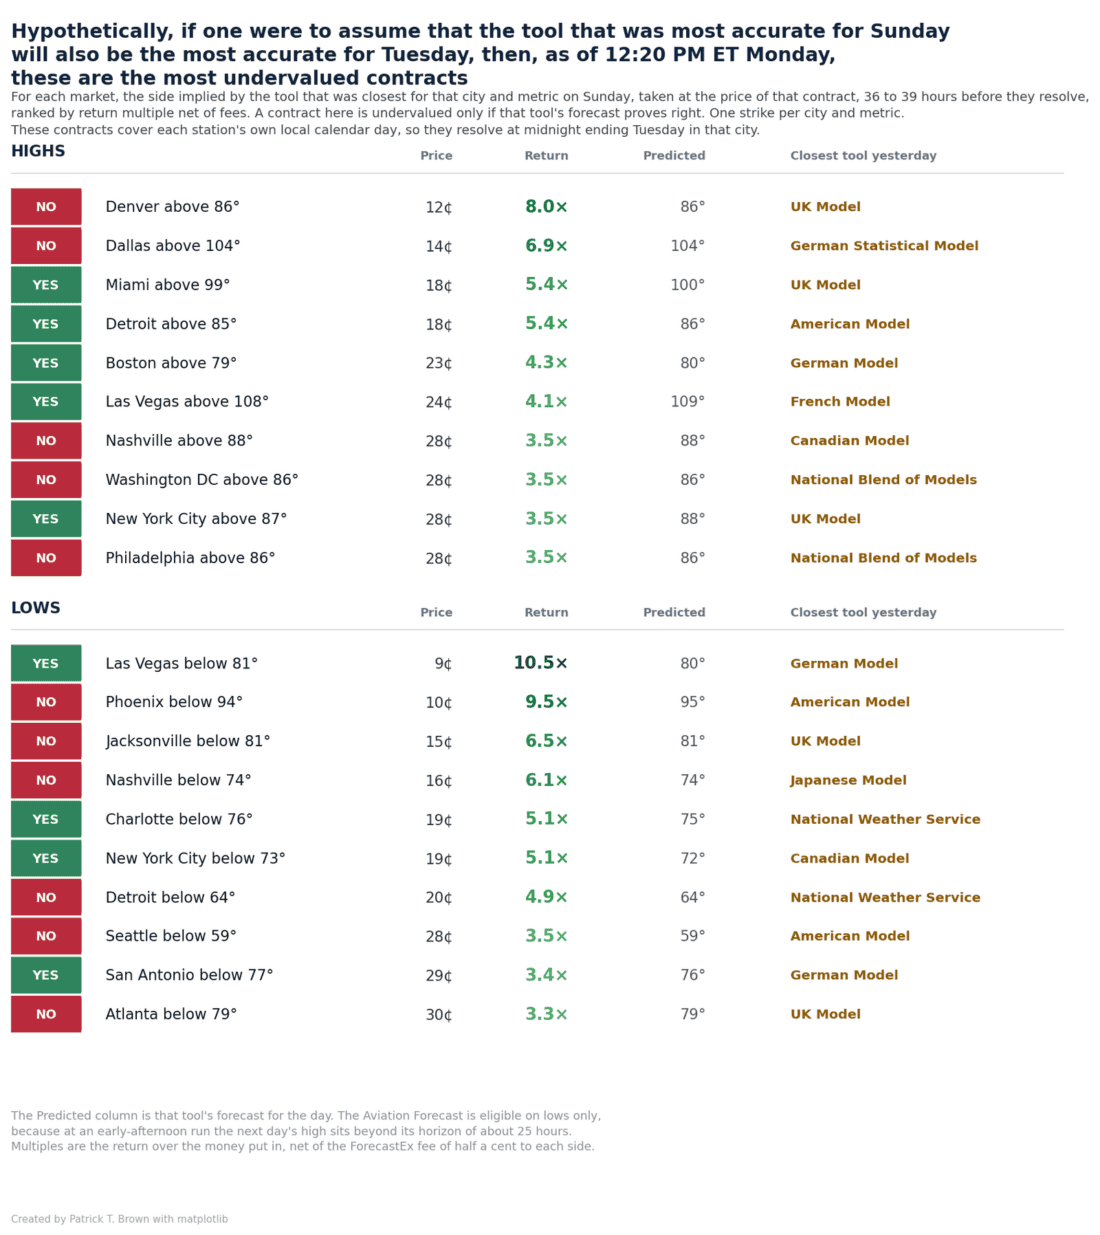
If the tool that was closest for each market on Sunday proves exactly right, the most undervalued contract on the high side is No on the Denver high above 86 degrees at 12 cents, an 8.0 times return net of fees, with the UK model predicting 86. On the lows it is Yes on the Las Vegas low below 81 degrees at 9 cents, a 10.5 times return net of fees, with the German model predicting 80.
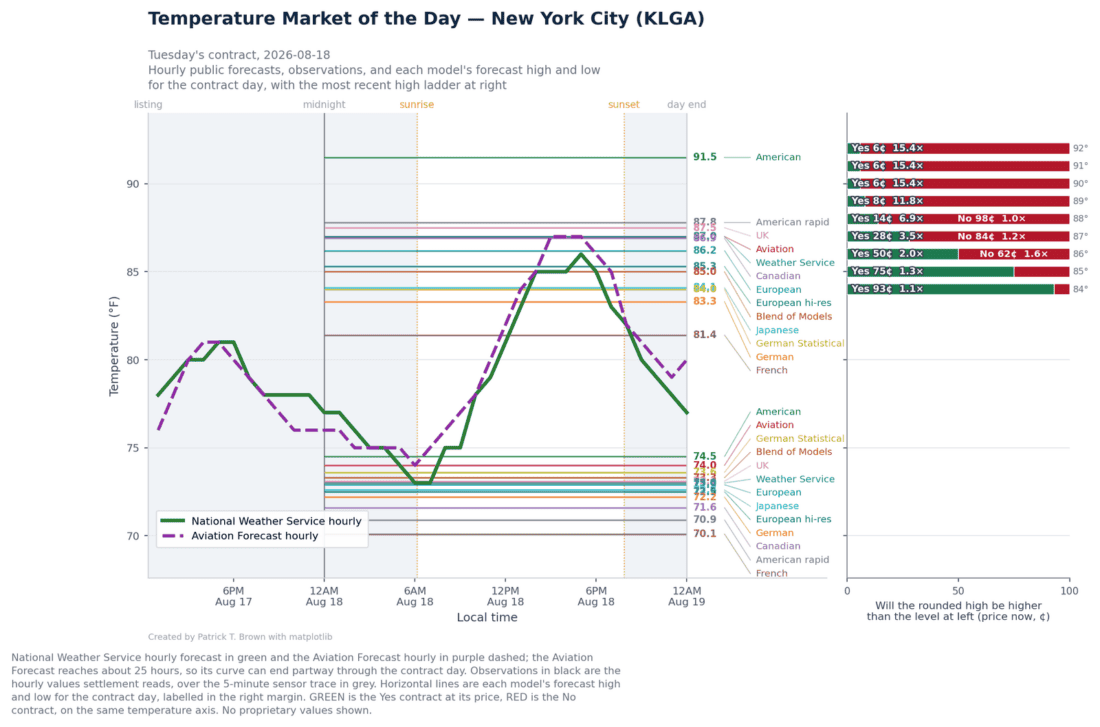
The highlighted market for Tuesday is New York City (KLGA)‘s daily high temperature contract. The figure above runs through the end of Tuesday, showing two independent hourly forecasts, each model’s forecast high and low for the contract day, and the most recent high ladder at right.
Thirteen models span 10.1°F on Tuesday’s high, from the American model at 91.5 down to the French model at 81.4, and the middle half of them sit 2.9°F apart. The American model is the outlier that creates most of that range, sitting 3.7°F above the next-highest model, and without it the remaining twelve span 6.4°F. The National Weather Service office serving New York City discusses a cold front moving in this afternoon with isolated to scattered showers and thunderstorms. Fronts typically create more forecast uncertainty, and it appears that a decent amount of the model spread for the Tuesday high is attributable to model disagreement on how long lingering clouds behind this front clear the area.
A market in which each contract pays one dollar if a stated weather outcome occurs and nothing if it does not, so the contract’s price is the market’s probability of that outcome. ForecastEx lists these on daily high and low temperatures at individual weather stations, on Atlantic named storm and hurricane counts, and on major hurricane landfall by location, among many others.
All four commonly referenced forecast systems rely on physical numerical weather prediction models that solve the equations of the atmosphere forward in time. ECMWF (the European model) and GFS (the American model) are shown here in their raw form. Raw physical models are flexible and can handle weather situations they have never seen (they are not explicitly trained on historical data but rather adhere to the laws of physics), but forecasts apply to a relatively large discrete grid box that contains the weather station rather than the single point where the station sits, causing them to carry systemic biases relative to the stations.
The Aviation Forecast is a model output statistics system. It compares historical forecasts from physical models with what actually occurred and uses the errors to statistically correct systemic biases at the level of individual weather stations. The tradeoff is that a statistical fit is anchored in past situations and bends less readily to a genuinely unusual one. The National Weather Service’s National Digital Forecast Database is undergirded by the National Blend of Models but layers on human forecasters’ judgment, which is more flexible in dynamic weather situations but introduces subjective judgment (more on all of this here).
ForecastEx does not publish a single forecast temperature. It lists a ladder of contracts at different strikes, and each price is the ForecastEx probability that the day’s extreme passes that strike. Comparing ForecastEx with the other systems therefore requires converting that ladder into a central estimate. The 50 percent level is the ForecastEx implied median, so where two adjacent listed strikes bracket that crossing, the central value is interpolated between them. Where the ladder does not bracket 50 percent, because every listed strike sits far in or far out of the money, no central value is recorded and ForecastEx is left unscored rather than extrapolated beyond the quoted ladder. That reflects how the strikes happened to be listed rather than anything about forecast quality, so it should count neither for nor against ForecastEx.
Prediction market basics
Temperature markets and energy
Hurricane and climate contracts
Patrick T. Brown is the Head of Climate Analytics at Interactive Brokers, where his work focuses on the information discovery and risk-transfer applications of prediction markets in weather, climate, and natural disasters.
He holds a PhD in Earth and Climate Science from Duke University, a master’s degree in Meteorology and Climate Science from San Jose State University, and a bachelor’s degree in atmospheric and oceanic sciences from the University of Wisconsin, Madison. He is an adjunct faculty member (lecturer) in the Energy Policy and Climate Program at Johns Hopkins University and has conducted research at the Carnegie Institution at Stanford University, NASA JPL at Caltech, NASA Langley in Virginia, NASA Goddard in Washington, D.C., and NOAA’s GFDL at Princeton University. He has published scientific papers in Nature, PNAS, and Nature Climate Change, as well as many disciplinary journals, and his research and commentary have appeared in The New York Times, The Wall Street Journal, The Economist, CNBC, CNN, The BBC, The Washington Post, NPR, Newsweek, The Guardian, The Atlantic, Foreign Policy, and The Los Angeles Times, among other venues.
New to Prediction Markets?
Open a Prediction Markets AccountThe analysis in this material is provided for information only and is not and should not be construed as an offer to sell or the solicitation of an offer to buy any security. To the extent that this material discusses general market activity, industry or sector trends or other broad-based economic or political conditions, it should not be construed as research or investment advice. To the extent that it includes references to specific securities, commodities, currencies, or other instruments, those references do not constitute a recommendation by IBKR to buy, sell or hold such investments. This material does not and is not intended to take into account the particular financial conditions, investment objectives or requirements of individual customers. Before acting on this material, you should consider whether it is suitable for your particular circumstances and, as necessary, seek professional advice.
The views and opinions expressed herein are those of the author and do not necessarily reflect the views of Interactive Brokers, its affiliates, or its employees.
Interactive Brokers LLC is a CFTC-registered Futures Commission Merchant and a clearing member and affiliate of ForecastEx LLC (“ForecastEx”). ForecastEx is a CFTC-registered Designated Contract Market and Derivatives Clearing Organization. Interactive Brokers LLC provides access to ForecastEx Forecast Contracts for eligible customers. Interactive Brokers LLC does not make recommendations with respect to any products available on its platform, including those offered by ForecastEx.
Displayed outcomes and prices are based on real-time market sentiment from ForecastEx LLC, an affiliate of IB LLC, as well as other CFTC-registered DCMs, including Kalshi and CME. For more information, see ibkr.com/realfex Note: Real-time market sentiment updates are only active during exchange open trading hours. Updates to current market sentiment for overnight activity will be reflected at the open on the next trading day. This information is not intended by IBKR as an opinion or likelihood of a potential outcome.
Futures, event contracts, and forecast contracts are not suitable for all investors. Before trading these products, please read the CFTC Risk Disclosure. For a copy, visit our Warnings and Disclosures Page.
This is commentary on economic, political and/or market conditions within the meaning of CFTC Regulation 1.71, and is not meant provide sufficient information upon which to base a decision to enter into a derivatives transaction.
Event Contracts are not available to clients of IBKR Canada.
Related Articles
















Join The Conversation
For specific platform feedback and suggestions, please submit it directly to our team using these instructions.
If you have an account-specific question or concern, please reach out to Client Services.
We encourage you to look through our FAQs before posting. Your question may already be covered!