
- Solve real problems with our hands-on interface
- Progress from basic puts and calls to advanced strategies
Interactive Options Course
Posted November 25, 2025 at 11:00 am
ForecastEx has launched weather-forecast prediction markets, allowing participants to take financial positions on the daily high temperatures for an initial offering of 10 US cities. Participants can access these markets on IBKR ForecastTrader.

From Google Earth.
Prediction markets for daily high temperatures can benefit both participants and external observers. Participating enables better-than-average forecasters to profit from their predictive skills (“you must be right more than 50.5% of the time to win”).
Additionally, for entities with a direct stake in temperature-sensitive outcomes, these markets offer a way to hedge risks. For instance, analysis from the International Energy Agency indicates that in hot weather, each additional degree can alter electricity demand by several percent. Therefore, the difference between a 97°F and a 100°F day is highly significant operationally for entities responsible for power supply. A retail electricity provider selling fixed-price energy might buy 100°F YES contracts at $0.40 each. If the temperature reaches 100°F (and thus the contract settles at $1.00), the $0.60 per-contract gain would help offset higher wholesale costs associated with increased air conditioning and, in turn, electricity demand.
The financial incentives involved motivate individuals who perceive mispricings to take positions that guide the probabilities toward accuracy. These continuously refined expectations then serve as a valuable public signal. Society has long valued accurate temperature forecasts to manage energy systems, prepare for heat and cold risks, plan daily operations, protect agriculture, and make countless smaller daily decisions, such as what to wear. These markets offer a system for collecting and summarizing information from existing forecasting methods and services, presenting it in a clear probabilistic framework that emphasizes inherent uncertainty rather than sidestepping it.
The rest of this article provides more details on the initial 10 contracts and offers some tools and established weather-forecasting techniques for participants to use to identify potential mispricings.
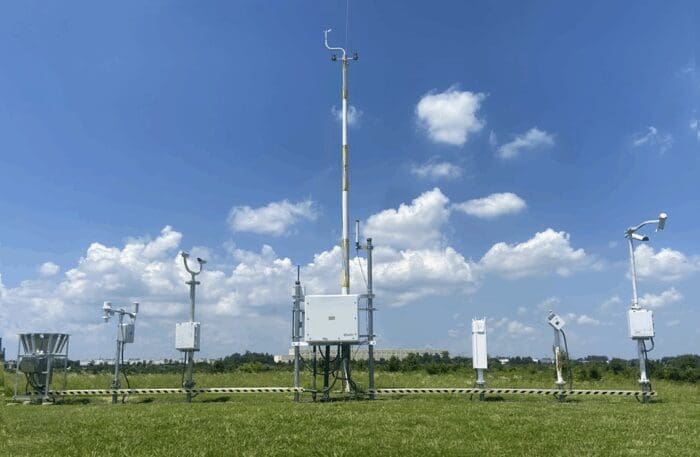
The most conventional daily high-temperature readings in the US are recorded by weather stations, such as Automated Surface Observing Systems operated by the National Weather Service. What is typically considered the most official of these for a given city is that city’s main airport’s station. (The exception in ForecastEx markets is the New York City station that is located in Central Park.) The daily high temperature values are reported in the National Weather Service’s Daily Climatological Reports.
Below are satellite images showing the locations of the initial 10 station sites. Temperature varies substantially in space across cities due to changes in land cover (e.g., park vs. concrete), proximity to the central district (urban heat island effect), shade, and other local factors such as hills and nearby bodies of water. Thus, precisely where the station is located can make a big difference.
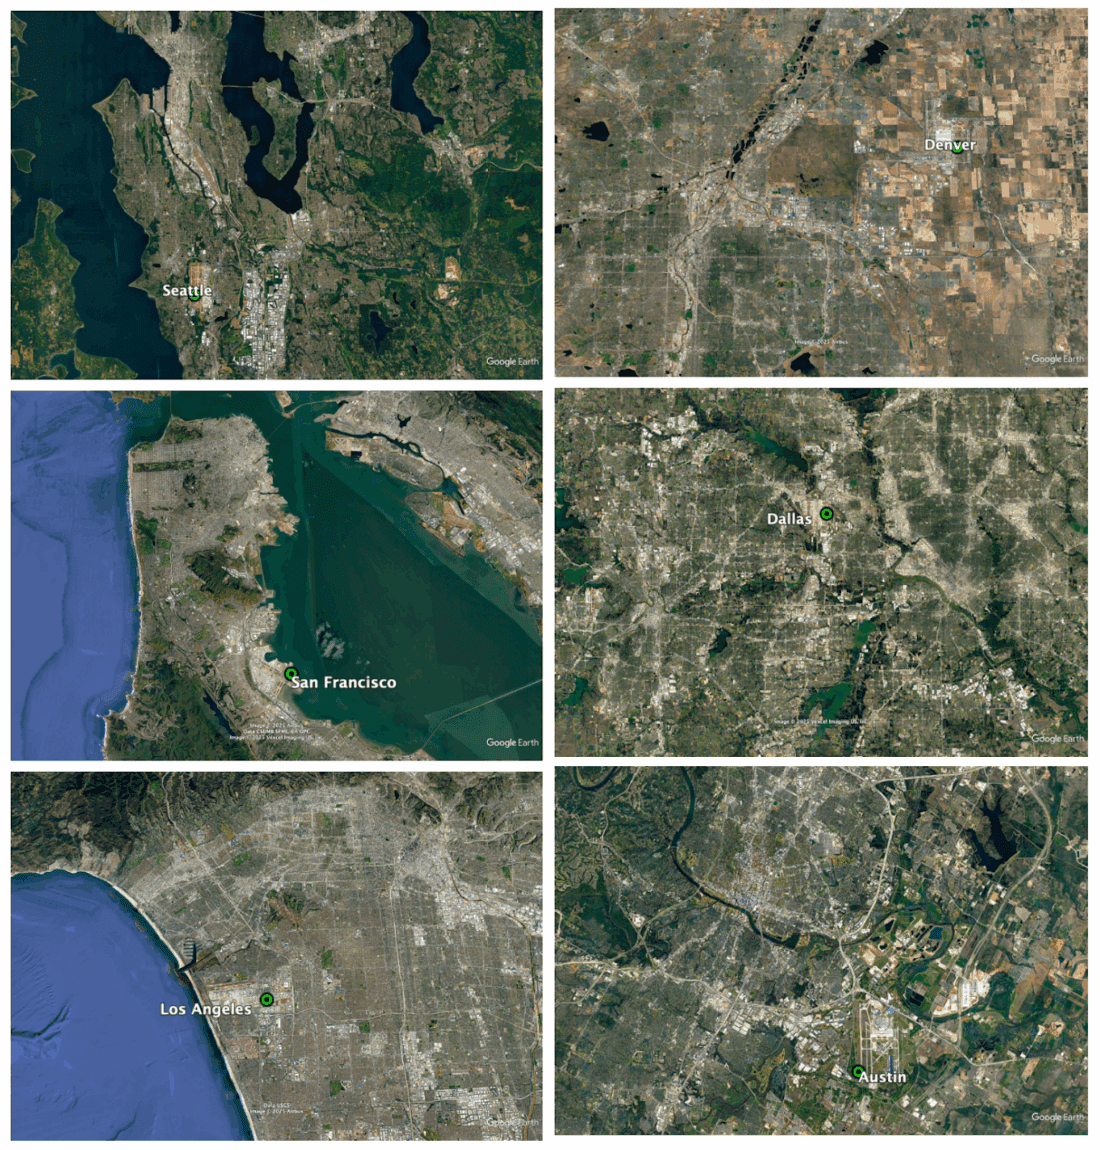
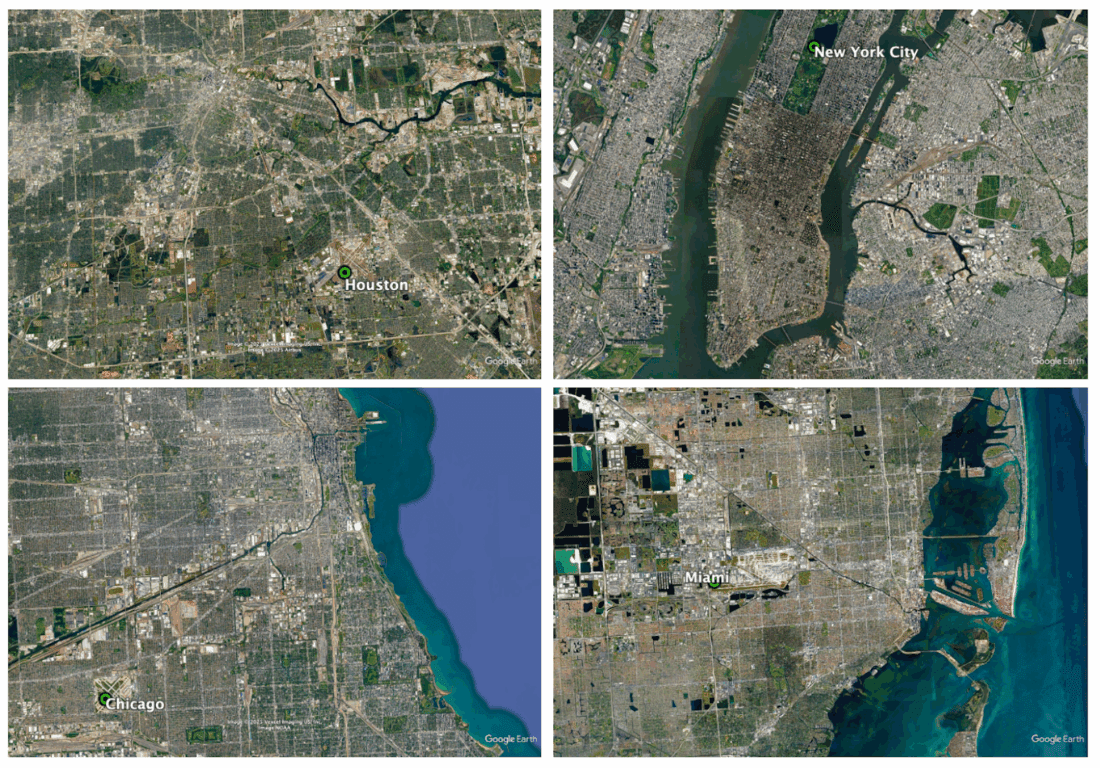
From Google Earth
At these weather stations, the sensor measures temperature every few seconds, but the daily high temperature must persist for more than an instant before it is recorded as such. Typically, the instrument combines higher-frequency samples into 1-minute averages and then computes a short-term moving average (usually over about 5 minutes). The daily maximum of that 5-minute moving average between 00:00 and 23:59 local time is then rounded to the nearest whole degree Fahrenheit and reported in the daily climatological reports. One important note is that when a strong cold front is moving through, the high temperature for a given day between 00:00 and 23:59 local time can sometimes be recorded at midnight, whereas most conventional weather forecasts you see online or on TV are for the afternoon high.
At least their initial version, ForecastEx daily markets for the next day’s high temperatures will reappear once each day. When these markets appear, they are assigned central strike values and initial probabilities to facilitate initial trading, with participants themselves subsequently modifying the probabilities.
The default public source for forecasts for US cities is the National Weather Service, so ForecastEx uses their data to establish central strike values. At their core, the National Weather Service forecasts rely on the National Blend of Models, which aims to combine dozens of physics-based weather models, including global, regional, deterministic, and ensemble types, into a single, unified forecast. Instead of selecting one model, the National Blend of Models statistically merges many models and applies systematic adjustments based on their historical performance. This information is then augmented by human forecasters and compiled nationally in the National Digital Forecast Database, which is gridded at a few-kilometer resolution.
These forecasted highs for the grid covering each station location serve as the central strike value in the ForecastEx markets. However, we all recognize that weather forecasts carry uncertainty. While it is common to present precipitation forecasts probabilistically, doing so for temperature forecasts is quite rare. Still, understanding the range of uncertainty in temperature forecasts is important, as it helps people grasp the available precision and assess tail risks. Currently, ForecastEx seeds prices with a relatively generic probability distribution centered on the strike value, using nine consecutive integer strikes surrounding the central strike (four on each side) for each city.
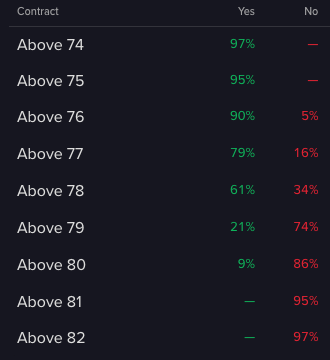
From IBKR ForecastTrader.
Once the initial probabilities are seeded, traders’ activity moves the odds from there. To be successful, participants must be able to identify where the National Weather Service default forecast is off and/or where the market is over- or underestimating uncertainty (meaning there is too much or too little probability density away from the central forecasted value.
I have participated in the National Forecasting Competition (hosted by the University of Oklahoma Meteorology program) as both a meteorology student and later as a faculty member teaching synoptic meteorology and weather forecasting. From these experiences, I know there are many opportunities for humans to consistently beat the generic National Weather Service forecasts.
There are many sites that provide an immense amount of weather information where forecasters can glean information on how meteorological conditions are evolving and thus get a general sense of when and where the National Weather Service forecasts might be off (e.g., sites like Pivotal Weather, Weathernerds, Windy, and College of Dupage Meteorology).
Below are additional tools tailored to the specific station locations of the initial 10 daily temperature markets on ForecastEx.
| City | Code | NWS Station Key | Station Lat, Lon | National Blend of Models | Live Station Readings | MeteoBlue Weather Model Ensembles | MeteoBlue Weather Model Recent Error | National Blend of Models Recent Error | NOAA GSL Ensemble Explorer |
|---|---|---|---|---|---|---|---|---|---|
| Austin | AUS | KAUS | 30.18304, -97.67987 | Link | Link | Link | Link | Link | Link |
| Chicago | MDW | KMDW | 41.78417, -87.75528 | Link | Link | Link | Link | Link | Link |
| Dallas | DFW | KDFW | 32.89743, -97.02196 | Link | Link | Link | Link | Link | Link |
| Denver | DEN | KDEN | 39.84658, -104.65622 | Link | Link | Link | Link | Link | Link |
| Houston | HOU | KHOU | 29.63750, -95.28250 | Link | Link | Link | Link | Link | Link |
| Los Angeles | LAX | KLAX | 33.93806, -118.38889 | Link | Link | Link | Link | Link | Link |
| Miami | MIA | KMIA | 25.79056, -80.31639 | Link | Link | Link | Link | Link | Link |
| New York City | NYC | KNYC | 40.78333, -73.96667 | Link | Link | Link | Link | Link | Link |
| San Francisco | SFO | KSFO | 37.61961, -122.36558 | Link | Link | Link | Link | Link | Link |
| Seattle | SEA | KSEA | 47.44472, -122.31361 | Link | Link | Link | Link | Link | Link |
Most physics-based weather models are computationally intensive and are thus run on supercomputers at most 4 times a day. Thus, a lot of information can come in at higher frequencies than the models can reflect. On the day of expiration, when much of the trading action will occur, forecasting the high temperature essentially involves observing how the atmosphere is changing relative to the story that the physics-based weather models predicted in their most recent runs.
A participant could ground their forecast with the 3-hourly National Blend of Models text forecast above (acronym key here). This can serve as the baseline against which a forecaster looks for deviations. It provides the expected evolution in moisture, sky cover, wind speed, wind direction, etc., associated with the National Weather Service’s expected temperature evolution.
Suppose that the national blend of models forecast indicates a high of 82°F, and that comes about under mostly sunny conditions with light southwest winds and a cold front passing through after 8:00 PM. That immediately indicates the necessary physical ingredients for reaching 82°F: long, unbroken sun and a late front. If that story appears to be unfolding accurately, then the ForecastEx central strike is probably reasonable. However, good forecasters can use the other tools in the table to assess whether the day is actually following the expected physical script.
The live station readings links show the current atmospheric conditions. Using those, a forecaster can observe temperature, wind, and cloud data from the exact sensor that resolves the contract. Continuing the example, if by late morning the station already reports 79°F under clear skies with southwest winds and no frontal activity, the heating is running ahead of schedule. This is a scenario where the high could be underestimated. Conversely, if the live page indicates persistent low clouds, gentle onshore breezes, and temperatures remaining in the low 70s, the physical conditions might not support a high of 82°F.
To understand which models might be telling a more plausible physical story as the day progresses, a forecaster could use the Meteoblue MultiModel Ensemble links provided above. This tool displays many physics-based weather models lined up on a single chart for each location. Not only is the forecasted temperature evolution shown, but also predictions for cloud cover, relative humidity, wind speed, and wind direction. If, for example, some models are warmer mainly because they clear the clouds two hours earlier and strengthen downslope winds, while others maintain persistent cloud cover and weaker mixing, a forecaster can see that directly. A forecaster could compare those scenarios with the live station page to determine which models’ high-temperature forecasts are likely to be most accurate in real time. If observations show early clearing and stronger winds, and that aligns with a “warm cluster” of models (while the market remains near the cooler National Blend of Models value), that’s a signal of a potential mispricing.
Another potentially useful tool linked above is Meteoblue’s recent error verification page, which shows how the multi-model mean has performed at that station over the past 3 days. If a forecaster notices the models have been consistently 2–3°F too cool in similar prevailing conditions recently, that can inform forecasts.
A similar logic applies to the recent-error plots for the National Blend of Models, which compare model performance to observations at daily resolution over the past month. If, for example, the National Blend of Models has been 3–4°F cooler on each of the last four sunny, calm days and is forecasting 82°F under a nearly identical pattern, it’s entirely reasonable to think the true central tendency is closer to 85–86°F. If the market remains anchored to the National Weather Service / National Blend of Models forecast, warmer values may be underpriced.
Finally, the NOAA GSL Ensemble Explorer provides a short-range, high-resolution view that is particularly valuable for addressing timing issues crucial for high-temperature forecasts. This tool allows forecasters to examine ensembles from HRRR and HREF and see the range of physically plausible conditions hour by hour. In particular, it helps identify the exact timing of frontal passages and other important meteorological features, such as marine layer erosion, afternoon convection, and diurnal wind patterns. If, for example, the National Blend of Models expects a front after sunset, but in the most recent update, most HRRR ensemble members now bring it through two hours earlier with related cloud and wind shifts, that significantly reduces the afternoon heating window. If the live station page shows evidence that the HRRR story is unfolding, the colder temperature values may be underpriced.
Overall, these tools can be used in a rough workflow to identify potential mispricings (profit opportunities) and to improve forecasts.
New to Prediction Markets?
Open a Prediction Markets AccountThe analysis in this material is provided for information only and is not and should not be construed as an offer to sell or the solicitation of an offer to buy any security. To the extent that this material discusses general market activity, industry or sector trends or other broad-based economic or political conditions, it should not be construed as research or investment advice. To the extent that it includes references to specific securities, commodities, currencies, or other instruments, those references do not constitute a recommendation by IBKR to buy, sell or hold such investments. This material does not and is not intended to take into account the particular financial conditions, investment objectives or requirements of individual customers. Before acting on this material, you should consider whether it is suitable for your particular circumstances and, as necessary, seek professional advice.
The views and opinions expressed herein are those of the author and do not necessarily reflect the views of Interactive Brokers, its affiliates, or its employees.
Interactive Brokers LLC is a CFTC-registered Futures Commission Merchant and a clearing member and affiliate of ForecastEx LLC (“ForecastEx”). ForecastEx is a CFTC-registered Designated Contract Market and Derivatives Clearing Organization. Interactive Brokers LLC provides access to ForecastEx Forecast Contracts for eligible customers. Interactive Brokers LLC does not make recommendations with respect to any products available on its platform, including those offered by ForecastEx.
This is commentary on economic, political and/or market conditions within the meaning of CFTC Regulation 1.71, and is not meant provide sufficient information upon which to base a decision to enter into a derivatives transaction.
For specific platform feedback and suggestions, please submit it directly to our team using these instructions.
If you have an account-specific question or concern, please reach out to Client Services.
We encourage you to look through our FAQs before posting. Your question may already be covered!
Related Articles


I see that on forecast trader, the daily temperature high now use weather underground as resolution basis, may I know if its one-off or permanent? We used to use NWS. Thanks.