
- Solve real problems with our hands-on interface
- Progress from basic puts and calls to advanced strategies
Interactive Options Course

Posted December 18, 2025 at 10:15 am
The range of plausible next-day temperature outcomes can translate into millions of dollars in differences in energy expenditure.
People prefer temperatures close to those experienced during most of human evolution in East Africa, around 65 to 70°F, which is why these numbers represent the canonical “indoor” temperature.
Thus, to achieve “indoor” temperatures when the outdoors are not providing them, we require energy to heat or cool spaces. Approximately half of all the energy used in homes and 40% of all the energy used in commercial buildings in the U.S. is for heating and air conditioning. So, the farther the outdoor temperatures are from human preferences, the more energy society will consume.
Americans cool buildings almost entirely with electricity, which comes from a variety of fuel sources, including about 42% from natural gas. Space heating in buildings is primarily provided by on-site natural gas combustion (though electric heat pumps account for a significant and growing share). About 15% of all U.S. natural gas use is directed toward on-site space heating of buildings.
Thus, since outdoor temperature affects demand for electricity and natural gas (both directly and through electricity production), prices of electricity and natural gas (on a dollar-per-unit-of-energy basis) will also be influenced by variations in outdoor temperature (though far less directly than total energy expenditure).
When the U.S. Energy Information Administration (EIA) recently updated its forecasts for winter 2025 to 2026 to reflect expectations for a colder winter, it also increased its projections for energy expenditure. That shows that, at least at the seasonal level, uncertainty in temperature has tangible impacts on financial uncertainty for many entities in the energy sector.
ForecastEx has markets designed to capture these dynamics and to be useful for reducing revenue volatility at the seasonal level.
But what about uncertainty in the next-day temperature? ForecastEx has recently launched weather-forecast prediction markets, allowing participants to take financial positions on the daily high and low temperatures for many cities across the U.S. Critically, the markets don’t just provide a central forecast but instead a ladder of strike thresholds with prices that can be interpreted as probabilities and thus are directly translatable into a forecast probability distribution.
So does the range of plausible temperatures in a next-day forecast (represented by the range in strikes and associated prices/probabilities) translate into any substantial difference in expectations for the day’s energy expenditure?
It turns out that the answer is yes.
I’ll illustrate with a schematic calculation using daily temperature forecasts for Thursday, December 18th, 2025, along with the most recent, as of that date, published wholesale electricity and natural gas prices by region.
The uncertainty in the temperature for various cities comes from assessing the spread among several (semi-independent) weather models (GFS, ICON, ECMWF, GEM, JMA, Meteo-France), NWS NDFD, and MOS (GFS/NAM) and weighing them based on their overlap with station observations over the recent past.
I convert the plausible temperature range for a next-day forecast into estimates of energy use. I then use the most recent natural gas and wholesale electricity prices for the region to convert energy use into energy expenditure. Finally, I use an estimate of the number of homes in the metro area to compute the total energy expenditure required to heat or cool the residences in the metro. See the appendix for details of the calculation.
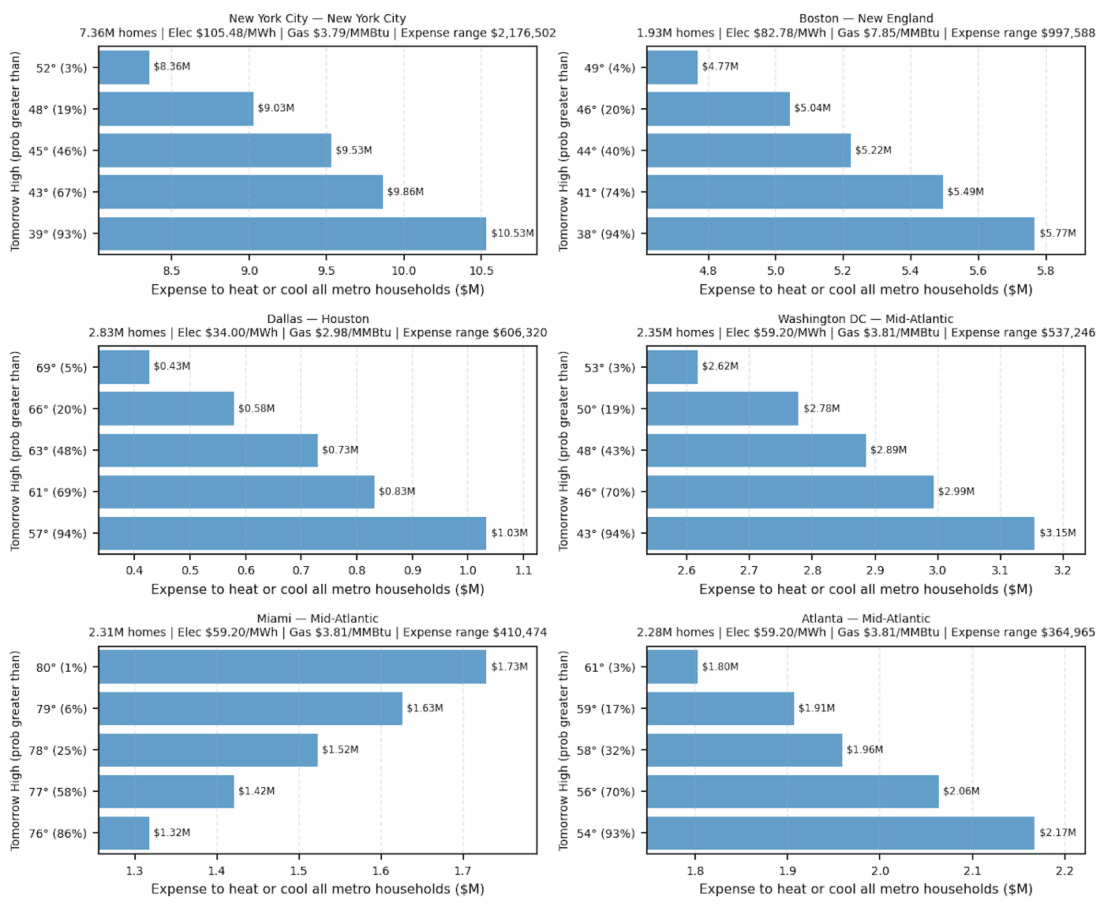
Below are the results for six cities listed in ForecastEx’s markets. The vertical axis shows the plausible range of tomorrow’s daily high temperatures, along with the probability of exceeding each temperature value.
The horizontal axis shows a rough estimate of the total residential energy expenditure in that metro area at that temperature.
The dollar difference between the lower and upper parts of the strike range represents a range in total cost of supplying all the residents in that metro with heating or cooling energy for that day (for e.g., a utility buying electricity and natural gas at wholesale prices).
For example, shifting from the mild (warmer) outcome (52°F, 3% chance of exceedance) to the substantially colder outcome (39°F, 93% chance of exceedance) represents a difference of over $2 million in energy expenditure for residences in the New York City metro alone.
Plot produced with Python Matplotlib.
This simple exercise highlights at least two reasons why prediction markets for daily temperature are useful in this context.
The first reason is the well-known attribute that the financial incentives of prediction markets tend to produce predictions with very high accuracy because those who continually make poor predictions are strongly incentivized to invest in strategies to improve or exit the market (effectively filtering out the worst forecasts). Thus, prediction markets naturally consolidate the best information from, for example, different models, domain experience, and perspectives into a single, continuously updated probability.
More precise knowledge of future temperatures (and thus energy demand) can lead to better-informed decisions about how many megawatt-hours of electricity and how many MMBtu of gas are needed, with operational and financial consequences.
For example, electric grid operators (Independent System Operators (ISOs) or Regional Transmission Organizations (RTOs)) make day-ahead decisions about which generators to commit and where on the grid to commit them. This is because power plants (especially thermal units) can’t always start instantly, and positioning resources closer to load centers decreases transmission congestion.
On the natural gas side, Local Distribution Companies (LDCs) and large gas consumers make “pipeline nominations” (the amount of gas they intend to take) and decide whether to withdraw from storage or buy spot gas on a daily basis.
Finally, large energy users such as data centers, factories, and large commercial campuses also make daily decisions about whether to shift production, pre-cool buildings, run on-site generation, curtail less-critical operations, or lock in supplemental energy supplies.
The second reason these prediction markets can be useful has to do with their structure, in which the various exceedence probabilities also represent the prices of the contracts. Operational and financial risks might escalate sharply in the tails, and the strike ladder makes it easy to take positions that pay off in costly scenarios.
For example, an electricity retailer might face a small risk of very high demand and very high procurement costs in the summer. Buying “YES” at the hotter strike tiers creates a payout in precisely those detrimental circumstances and could help protect the entity from major losses on that day.
On the other hand, a natural gas utility’s risk might be associated with warmer winter temperatures, which reduce heating demand and revenue. In such cases, buying “YES” exposure at warmer (milder) strike tiers creates a payout for those detrimental days, potentially offsetting revenue losses.
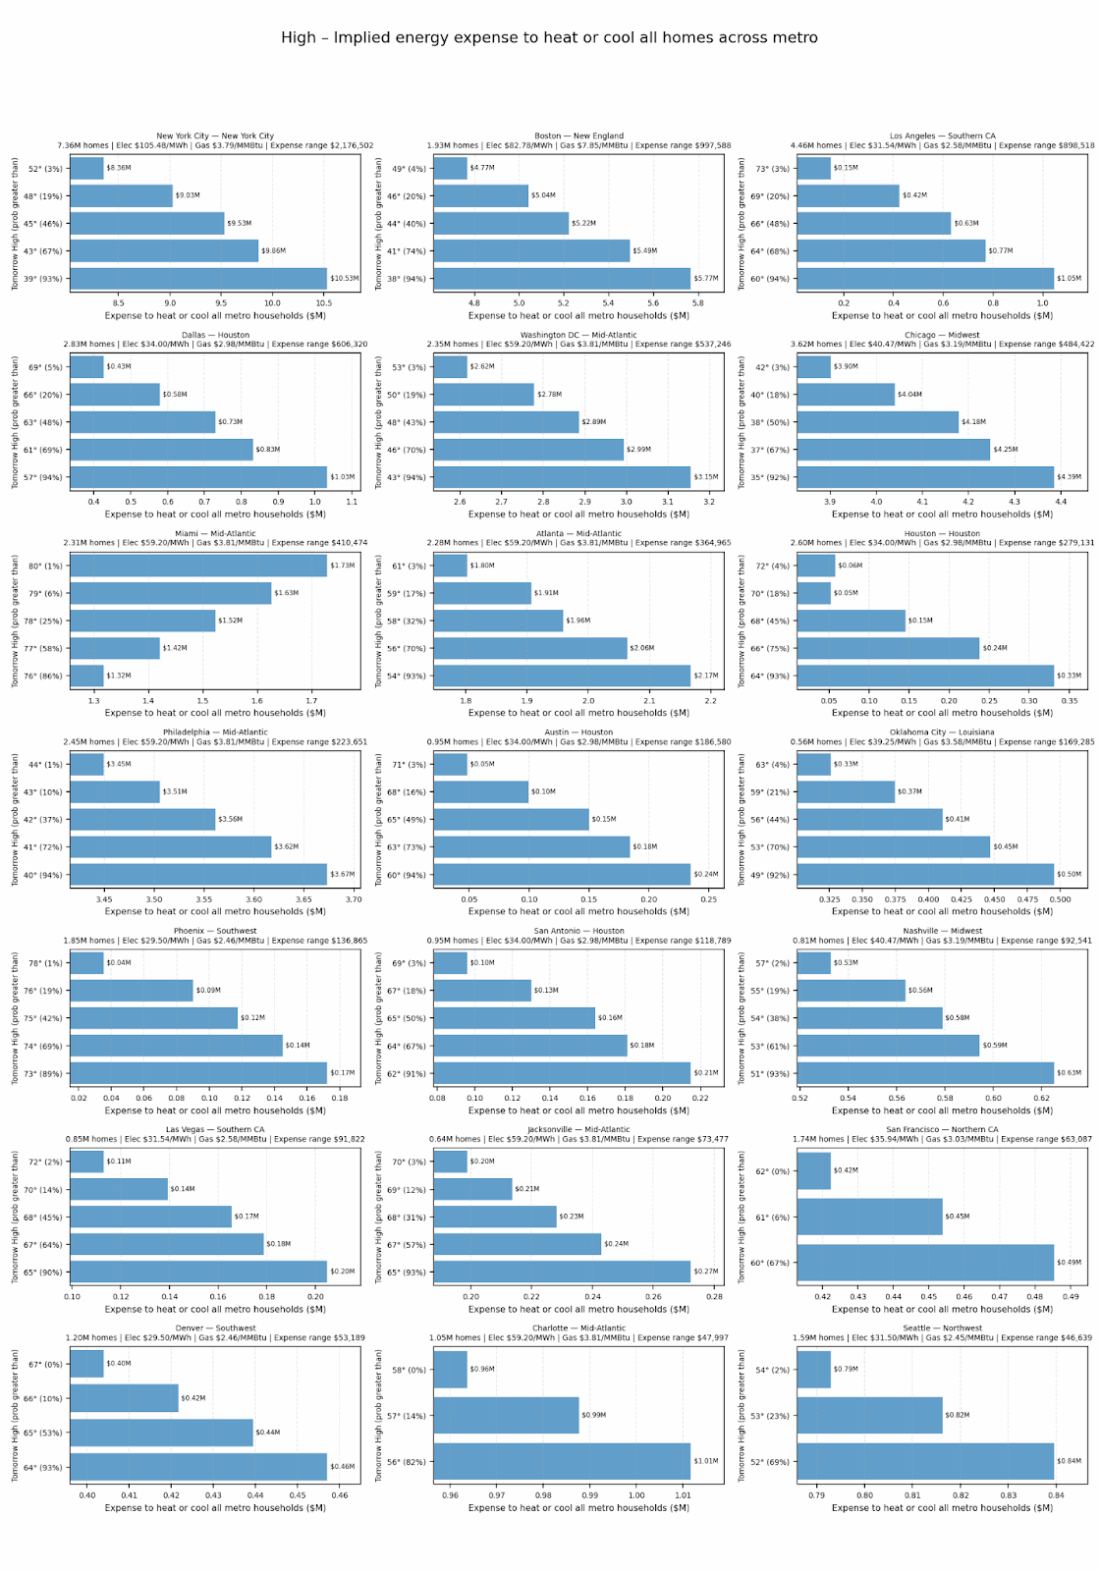
Overall, this analysis demonstrates that uncertainty in day-ahead temperatures corresponds to significantly different energy use and expenditure across metro areas, which can inform operating and financial considerations for various entities involved in energy. A typical weather forecast tells you tomorrow’s “expected high,” but ForecastEx’s prediction markets on temperature provide precise probabilities defining the uncertainty range and direct financial instruments that can be used to hedge against the worst scenarios.
These calculations are meant to convey the rough scale of the uncertainty in the effect of a next-day temperature forecast on the uncertainty in energy expenditure over a metro area.
The calculation takes a plausible range of temperature outcomes for the next day (the temperature strikes), converts each temperature strike in the market into an implied heating or cooling requirement per household, multiplies by recent wholesale regional prices for electricity and natural gas, and scales that expense by an estimated number of households in the city’s metro area.
Step 1: Estimate the daily mean temperature from each high or low temperature in the market
The temperature markets are defined by daily extremes (the daily high or low), but the day’s mean temperature more closely approximates space-heating and space-cooling needs. For each strike temperature in the market, I estimate an implied daily mean using the standard approximation:
Tmean ≈ (Thigh + Tlow)/2.
When evaluating high-temperature outcomes, the associated low temperature is taken from the central forecast for that location and date; when evaluating low-temperature outcomes, the associated high temperature is taken from the central forecast.
Step 2: Convert the daily mean temperature into degree days
Next, the implied mean temperature is converted into Heating Degree Days and Cooling Degree Days using the conventional 65°F reference point:
CDD = max(0, Tmean−65),
HDD = max(0, 65−Tmean).
Higher Cooling Degree Days correspond to greater cooling demand, and higher Heating Degree Days correspond to greater heating demand. These measures compress a full day’s weather into a single metric and therefore ignore humidity, solar radiation, wind, building thermal inertia, and thermostat behavior, and they approximate the demand response as linear even though real demand can become more nonlinear in extremes.
Step 3: Estimate the number of households in the metro area around each city
To translate per-home energy needs to a metro-scale, I use total-household estimates for Core Based Statistical Areas taken from the American Community Survey (ACS). Household counts allow for differential scaling across metros that differ substantially in size, but they do not capture differences in commercial and industrial energy use, housing stock, heating fuel, insulation quality, or air-conditioning prevalence.
Step 4: Convert degree days into an illustrative estimate of energy use
Degree days are then converted into energy use using simple linear relationships derived from historical data. I use these formulas:
Cooling energy (electricity) = CDD×αCDD×Nhomes
Where the coefficient αCDD is 1.5 kWh/CDD/home/day.
Heating energy (natural gas) = HDD×αHDD×Nhomes
Where the coefficient αHDD is 0.012 MMBtu/HDD/home/day
Those two coefficients (αCDD and αHDD) are estimated from EIA’s most recent Residential Energy Consumption Survey (RECS) combined with recent observed estimates of population-weighted CDDs and HDDs.
The RECS survey indicates that there are 123.53 million homes in the U.S. It also reports that in 2020, U.S. homes used 866 trillion BTU, or about 254 billion kWh, for air conditioning or 2,060 kWh/home/year. EIA also reports that the United States experiences roughly 1,500 population-weighted CDDs per year. Assuming annual air-conditioning electricity use scales roughly with annual CDD totals, we get 1.5 kWh/CDD/home/day.
For heating, RECS reports average natural gas space-heating consumption of about 44.9 MMBtu/home/year. EIA also reports that the United States experiences roughly 4,300 population-weighted HDDs per year. Assuming annual space-heating gas use scales roughly with annual HDD totals, we get 0.012 MMBtu/HDD/home/day.
Step 4: Convert energy quantities into dollars using wholesale prices
The total residential energy expenditure is estimated using wholesale regional electricity and natural gas prices from EIA’s Daily Prices reporting for the region closest to the metro in question.
Electricity prices reflect both long-term costs of building, financing, maintaining, and operating power plants and transmission and distribution systems, as well as short-term fluctuations in fuel prices and weather-related changes in supply from wind, solar, and hydropower generation.
Electricity prices are often broken down into wholesale prices and the retail rates you see on your utility bill. Wholesale prices are the upstream, bulk prices paid when electricity is bought and sold between generators, utilities, retailers, and other large market participants. In much of the country, wholesale pricing is organized through markets run by Independent System Operators (ISOs) and Regional Transmission Organizations (RTOs). They are highly variable in time as they are designed to reflect short-term supply and demand conditions, fuel costs, and the physical constraints of the power grid.
In particular, higher electricity demand (e.g., due to high heat, which increases cooling demand) requires the activation of more costly generation sources to satisfy that demand and thus increases the average wholesale price of electricity.
Natural gas prices reflect the state of production, storage, pipeline, and infrastructure constraints, overall economic health, and the availability and prices of alternative fuels. Increased heating demand can increase natural gas prices, but due to storage capacity, this is not typically reflected on a day-by-day basis.
Plot produced with Python Matplotlib.
New to Prediction Markets?
Open a Prediction Markets AccountThe analysis in this material is provided for information only and is not and should not be construed as an offer to sell or the solicitation of an offer to buy any security. To the extent that this material discusses general market activity, industry or sector trends or other broad-based economic or political conditions, it should not be construed as research or investment advice. To the extent that it includes references to specific securities, commodities, currencies, or other instruments, those references do not constitute a recommendation by IBKR to buy, sell or hold such investments. This material does not and is not intended to take into account the particular financial conditions, investment objectives or requirements of individual customers. Before acting on this material, you should consider whether it is suitable for your particular circumstances and, as necessary, seek professional advice.
The views and opinions expressed herein are those of the author and do not necessarily reflect the views of Interactive Brokers, its affiliates, or its employees.
Interactive Brokers LLC is a CFTC-registered Futures Commission Merchant and a clearing member and affiliate of ForecastEx LLC (“ForecastEx”). ForecastEx is a CFTC-registered Designated Contract Market and Derivatives Clearing Organization. Interactive Brokers LLC provides access to ForecastEx Forecast Contracts for eligible customers. Interactive Brokers LLC does not make recommendations with respect to any products available on its platform, including those offered by ForecastEx.
This is commentary on economic, political and/or market conditions within the meaning of CFTC Regulation 1.71, and is not meant provide sufficient information upon which to base a decision to enter into a derivatives transaction.
Related Articles


 Collapse? Prediction Markets Can Quantify Sentiment")

Join The Conversation
For specific platform feedback and suggestions, please submit it directly to our team using these instructions.
If you have an account-specific question or concern, please reach out to Client Services.
We encourage you to look through our FAQs before posting. Your question may already be covered!