
- Solve real problems with our hands-on interface
- Progress from basic puts and calls to advanced strategies
Interactive Options Course

Posted February 3, 2026 at 1:06 pm
Amidst the turmoil in various assets – I’m thinking of you, precious metals, cryptocurrencies, and various tech stocks – stock indices and bond yields remain relatively placid. The Cboe Volatility Index (VIX) remains mired in the mid-teens, and the ICE BofA Move Index, which measures US bond market volatility, is at a level not seen in over 4 ½ years. The appearance of calm indices even as some of their components are gyrating is an important consideration for investors.
Amidst some big intraday swings in precious metals last week, we wrote on Thursday about how volatility tends to increase at turning points. That topic understandably arose during a media appearance amidst the next day’s plunges in precious metals. One of the hosts asked an important question – might we be seeing something similar in stock and bond markets to the volatility that presaged Friday’s metals meltdown? My answer was a resounding “maybe.” Remember, this was just a day after we saw double-digit post-earnings moves in key stocks with multi-trillion-dollar capitalizations (Microsoft (MSFT), -10.0%, and Meta Platforms (META), +10.4%). Individual stocks and whole sectors are clearly putting in some major moves, but often in offsetting directions.
Rotation is occurring. The tricky question is whether it is a benign reallocation of exposure or a sign of some underlying instability.
Within equities, one place to look is the Cboe Dispersion Index (DSPX). It measures:
the expected dispersion in the S&P 500® over the next 30 calendar days, as calculated from the prices of S&P 500 index options and the prices of single stock options of selected S&P 500 constituents, using a modified version of the VIX® methodology.
The Cboe website further explains:
From a theoretical perspective, the Dispersion Index uses the level of the VIX Index as an explicit input to its calculation, where its square used to represent the expected variance of the S&P 500 over the next 30 days. The Dispersion Index also uses a version of the VIX Index methodology to calculate expected variances for the S&P 500’s constituents, which are also inputs to the Dispersion Index calculation.
Based on the methodology alone, all else being equal, if the VIX Index rises, the Dispersion Index would be expected to decline. However, all else is not typically equal: when S&P 500 index volatility rises, the volatility of S&P 500 constituents typically also increases, and if the market expectations for single stock variances rise more than the expectations for index variance, then the Dispersion Index would be expected to increase together with the VIX Index. Empirically, this has frequently been the case…
In recent weeks, we have seen DSPX rise even as VIX remains relatively contained. While this can be a boon to stock pickers who are able to select the divergent winners and losers, it also shows that traders are pricing in much more volatility for key index components than they are for the index itself. In the chart below, we see that there were similar bumps in DSPX relative to VIX in July-August 2024, February 2025, and October 2025. All of those spreads were followed by dips in SPX, though of course all amounted only to short-term dips (one of which was quite significant), rather than major turning points.
2-Years, DSPX (red/green daily candles, right scale), VIX (purple line, left scale)

Source: Interactive Brokers
Dispersion is commonly thought of as the flip side of correlation. In prior pieces, we have noted similar divergences between the Cboe 1-Month Implied Correlation Index (COR1M). In the case of COR1M, however, the methodology is similar to that of DSPX:
The Cboe Implied Correlation index measures correlation market expectations by quantifying the spread between the SPX index implied volatility and the average single-stock basket component implied volatility.
We have noted times when VIX exceeded COR1M by a significant amount as situations when index traders are indicating more caution than the market correlations imply. It can presage market dips. That said, while we saw that sort of divergence earlier this month, it has since closed considerably.
6-Months, COR1M (red/green candles), VIX (blue line)
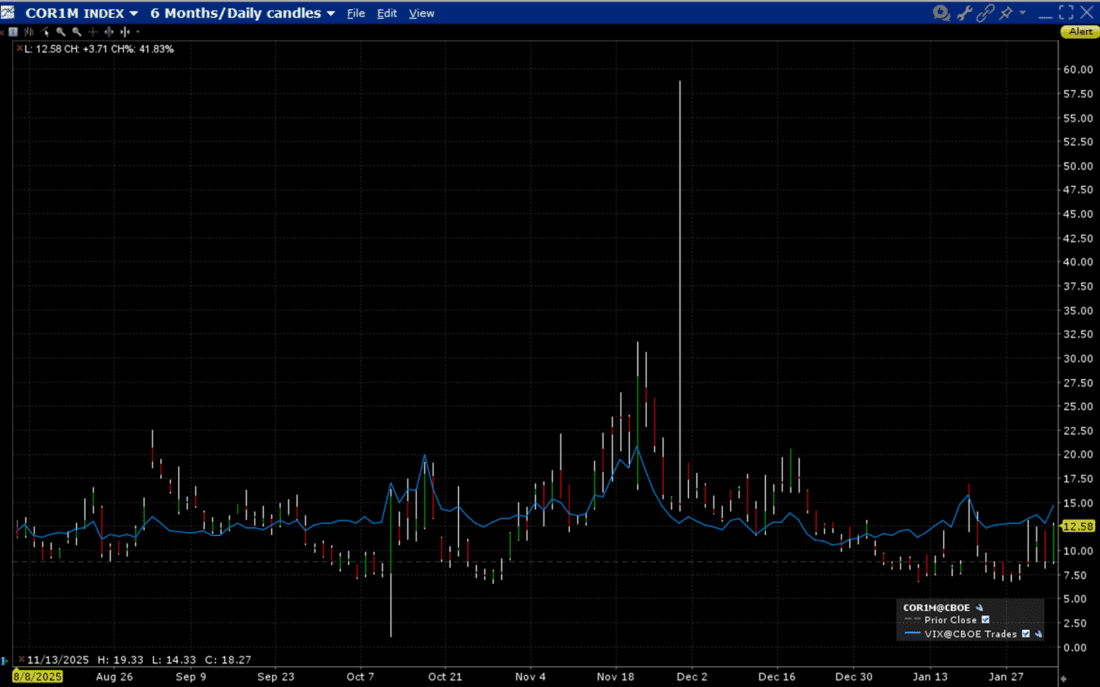
Source: Interactive Brokers
While the scenario remains murky, I find it impossible to ignore the huge crosscurrents underneath the placid surfaces of the stock market. It is difficult to say that a major turning point is upon us, but I do fear that the past divergence in COR1M and the current one in DSPX should make traders at least a bit wary of a potential pop in volatility.
5-Years, MOVE (white daily dots), 50-Day Moving Average (yellow line)

Source: Bloomberg
New to Interactive Brokers?
Open AccountAlready an Interactive Brokers Client?
Request Trading PermissionThe analysis in this material is provided for information only and is not and should not be construed as an offer to sell or the solicitation of an offer to buy any security. To the extent that this material discusses general market activity, industry or sector trends or other broad-based economic or political conditions, it should not be construed as research or investment advice. To the extent that it includes references to specific securities, commodities, currencies, or other instruments, those references do not constitute a recommendation by IBKR to buy, sell or hold such investments. This material does not and is not intended to take into account the particular financial conditions, investment objectives or requirements of individual customers. Before acting on this material, you should consider whether it is suitable for your particular circumstances and, as necessary, seek professional advice.
The views and opinions expressed herein are those of the author and do not necessarily reflect the views of Interactive Brokers, its affiliates, or its employees.
Options involve risk and are not suitable for all investors. For information on the uses and risks of options, you can obtain a copy of the Options Clearing Corporation risk disclosure document titled Characteristics and Risks of Standardized Options by going to the following link ibkr.com/occ. Multiple leg strategies, including spreads, will incur multiple transaction costs.
For specific platform feedback and suggestions, please submit it directly to our team using these instructions.
If you have an account-specific question or concern, please reach out to Client Services.
We encourage you to look through our FAQs before posting. Your question may already be covered!
Related Articles


Have you also looked at the S&P 500 Constituent Volatility Index which is similar to the dispersion index?
Great suggestion, thanks
How could anything possible go wrong when things are going so great? I need more source code, more data, and most of all, more not-actually-misspent-after-all AI-driven money.