
- Solve real problems with our hands-on interface
- Progress from basic puts and calls to advanced strategies
Interactive Options Course
Posted February 6, 2026 at 9:00 am
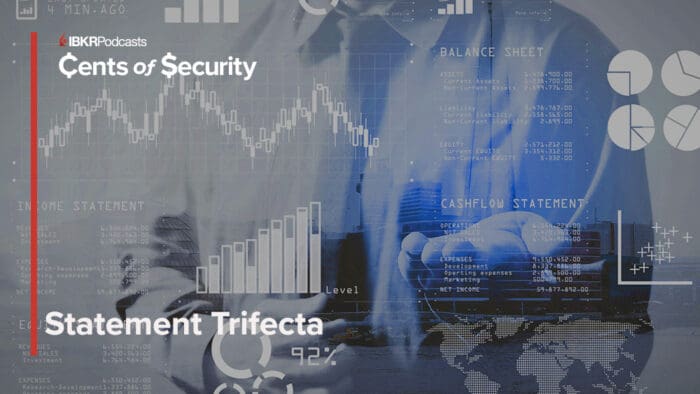
In this episode of Cents of Security, Mary MacNamara sits down with James Yendrey of Interactive Brokers InvestMentorSM to break down the income, balance sheet, and cash flow statements. Let’s revisit this during earnings season to better understand how companies measure performance, stability, and real cash health.
The following is a summary of a live audio recording and may contain errors in spelling or grammar. Although IBKR has edited for clarity no material changes have been made.
Hello everybody and welcome to Cents of Security. I am here today to talk about financial statements with James Yendrey of Interactive Brokers InvestMentorSM, right now we’re in the midst of earning seasons, so I thought it would be really good to do a podcast on the three core financial statements.
And luckily, we have James’s here. First question, James, how are you?
I’m doing good. Thanks for having me.
Good. Good. In a nutshell, what are the three financial statements, and we’ll dive into each one in more depth in a few minutes, but what are they just in a nutshell?
So, to keep it simple you have the three big ones are the income statement, balance sheet, and your cash flow statement. So your income statement is performance over time, your revenues, expenses, profit and loss quarter over quarter, year over year. Balance sheet basically shows a snapshot of what the company owes what it owns, and what’s left over for shareholder holders like equity, cashflow statement is actual cash, moving in and out, dividends, into operations, investing, financials, things of that nature.
So let me ask you a question. Do we really need, as investors, all three of these financial statements and instead of just focusing on earnings.
Yeah, I would say yeah, because earnings don’t really tell the full story. Account accounting rules, like companies’ kind of report profits while cash isn’t necessarily flowing. Debts could be potentially mounting assets could be deteriorating. An example would be companies company books 10 million in December but doesn’t collect payment until mid-March.
So the income statement shows a profit, but the cash flow statement reveals there’s no cash yet.
Interesting. So, let’s drill down a little bit more. So, what is the balance sheet and why is it one of the core financial statements that companies use?
Source for first image (balance sheet): Excel sample template
So, the balance sheet is a snapshot and a point of time, usually the last day of a quarter or a year. It really answers three core questions. What do we own? What do we owe, and what’s left for shareholders? And it follows a simple equation that you know, people tend to use in there, day-to-day life.
You have your assets equal liability, plus shareholder equity. Simple as that. It’s core because it reveals financial stability. Strong assets with manageable debt usually mean resilience. High liabilities relative to asset means could mean a potential fragility even if currently profitable.
So, when looking at the balance sheet for the first time, what are some of the important numbers or ratios that beginners should focus on?
So, assets, liabilities, and shareholder equity. So really just covering the top three things that are in the overall equation. So, what does the company own? So, you want to evaluate what the company’s current assets are, their cash, their inventory, receivables, convertible to cash within a year and not current assets.
So, things like buildings, equipment long-term views. So, then you look at the liability section, what the company owes. So, what are their debt loads? Are there huge bills coming up with this next year? The long-term liabilities? What’s, what are their long-term debt strategies, pension obligations, things like that.
And then you go into the shareholder equity position. Essentially what’s left over by subtracting liabilities from assets paid in capital, original shareholder investments, and retained earnings. So its a snapshot, that’s what you’re attempting to get, because equity is more or less is the residual claim to the company, right?
It’s the company’s liquidity, paid all debts. The equity is what shareholders would theoretically get if they were to sell the company.
Got it. That’s important. So many beginners, including myself, confuse cash with profit. How do, how does a balance sheet help clarify the difference between these two?
Like an example I had given, because you say you have $10 million that came in December, but you’re not necessarily collecting cash. You can be cash poor, and so you don’t necessarily have that cash flow, particularly in the bank. So, you want to be able to determine are you able to sustain the company over that period of time while you’re waiting for that cash flow to arrive.
That’s why it’s important.
So, let’s move on Now, what about the income statement?
So, income statement in my opinion it’s the most straightforward one. Granted, there’s a little bit of math behind it, but the income statement or the P&L effectively feeds into everything else, right? It feeds into the balance sheet.
So, the income statement shows the financial performance over the period. What did the company actually make or lose? So, you’re getting into the nitty gritty your revenues, minus your COGS, your cost of goods sold, that equals gross profit. So, then you take a gross profit minus operating expenses like your salaries, your marketing, your R&D, that equals operating income.
Then you take your operating income minus taxes and interest, and that equals your net income or your bottom line. And you’ll take that net income and that’s where you get your EPS because it’s net income divided by outstanding shares.
So that kind of breaks it down a little bit further so you can get your EPS estimates, whether they, whether the company beat or missed estimates.
So once again, EPS equals earnings per share. All right so if a company reports massive net income, why might it still be struggling financially?
Revenue without Cash collection and the previous example sales that are booked but not necessarily paid receivables tend to pile up and it’s not liquid cash yet. You can have non-cash gains asset sales, investment gains, tax benefits, inflated earnings without operational cash flow under investment slashes, capital spending to boost short-term profits while the business can potentially deteriorate over the long term. High debt load levels, net income doesn’t account for debt principles or repayment, usually only interest. Cash bleeds paying down loans, then you could potentially have inventory buildup if you have that type of overhead.
So, production counted as revenue and sold, but if it’s unsold inventory, it ties up your liquidity.
Okay. There’s a lot there. So, what is a cash flow statement then? That’s the third of the trifecta, right? There’s balance income statement, and then we have this cash flow.
Yeah, so cash flow statement tracks actual cash moving in and out. It’s broken into three different sections. Your operating activity, your investing activities, and your financing activities. Operating activities, usually cash, running from the core business, your collections, your payments suppliers, the means.
Then you have your investing activities cash spent for long-term assets and equipment like acquisitions or, big infrastructure equipment that you may need for over a long period of time. And then financing activities, cash from investors or creditors, borrowing, repaying debt ensuing stocks and paying dividends.
It’s the hardest to manipulate because cash is relatively objective. It’s either there or it’s not.
So why is operating cash flow so important for assessing a company’s health?
So operating cash flow measures whether the core business is actually generating day-to-day cash. Everything else, borrowing selling assets, issuing stock is, temporary or diluted. Strong operating cash flows enables reinvestment to growth, dividends or buybacks, debt reduction weathering turndowns, and having more or less more liquidity to weather a potential storm.
Weaker, negative operating cash flow means dependence on a lot of external financing, which will likely increase debt burdens. And that’s, unsustainable long term.
All right we’re done with cashflow for now. So, what’s the simplest way that our listeners can remember the role of each statement? Is there some sort of like buzzword we could use?
Just break it down into three questions. Your income statement is, how did we do your performance? Balance sheet is what do we owe and what do we own? So, what is your current position and cashflow statement is, where did the money go? Your reality check, right? It’s, it is showing your liquidity level.
That is awesome. I’m so glad that you were able to spell this out for us, especially with we’re going to break down an earnings call or do something like that on the next podcast. So, I think hopefully with all this information, we may have to listen to this a couple times and also review the study notes.
But in general, James Yendrey of InvestMentorSM at Interactive Brokers. Thank you so much.
Thank you, Mary. Great to be here.
Information posted on IBKR Campus that is provided by third-parties does NOT constitute a recommendation that you should contract for the services of that third party. Third-party participants who contribute to IBKR Campus are independent of Interactive Brokers and Interactive Brokers does not make any representations or warranties concerning the services offered, their past or future performance, or the accuracy of the information provided by the third party. Past performance is no guarantee of future results.
This material is from IBKR InvestMentor, an affiliate of Interactive Brokers LLC, and is being posted with its permission. The views expressed in this material are solely those of the author and/or IBKR InvestMentor and Interactive Brokers is not endorsing or recommending any investment or trading discussed in the material. This material is not and should not be construed as an offer to buy or sell any security. It should not be construed as research or investment advice or a recommendation to buy, sell or hold any security or commodity. This material does not and is not intended to take into account the particular financial conditions, investment objectives or requirements of individual customers. Before acting on this material, you should consider whether it is suitable for your particular circumstances and, as necessary, seek professional advice.
For specific platform feedback and suggestions, please submit it directly to our team using these instructions.
If you have an account-specific question or concern, please reach out to Client Services.
We encourage you to look through our FAQs before posting. Your question may already be covered!


Wonderful presentation for a lay man