
- Solve real problems with our hands-on interface
- Progress from basic puts and calls to advanced strategies
Interactive Options Course

Posted April 21, 2025 at 11:22 am
Read the first installment in this series here: Kris Boudt Part One: Quant Innovator, Professor, Entrepreneur.
For many years, Kris Boudt, Professor, quant analyst, and co-founder of advanced textual analysis firm Sentometrics, has been a regular participant in Chicago’s annual R Finance Conference. His involvement began in 2007 with its precursor, “The 1st International R/Rmetrics User and Developer Workshop,” held in Lake Thune, Switzerland.
“They locked us in a hotel in the Alps, surrounded by beautiful landscapes and not much else. For five days, we had no choice but to interact with each other. A lot of the work happened over meals and beers. It was the most important workshop of my life.”
“I was 23 and full of energy. One morning, I happened to be sitting at breakfast with Brian Peterson, who later became one of the R Finance conference organizers. He’d developed a package for performance analytics. Over coffee, he asked me, ‘Do you know about Cornish–Fisher expansion?’
“I didn’t know. It’s a way to take into account the non-normality of data when you estimate value-at-risk. If you use a normal distribution to estimate the risk of losing money, the estimate is biased. If you use Cornish-Fisher, you take into account skewness and kurtosis. Brian explained all this to me at breakfast, and I thought I had it. Except at lunch, he told me he’d only explained the easy part, when there’s just one asset. The difficult part is when there are 10 assets, or 20, and you have to think of your portfolio return in powers of three and four. At those levels, there are so many interactions, so many combinations.”
Between lunch and dinner, Boudt skipped the conference’s formal activities to focus on devising a solution that might implement Cornish-Fisher.
“I wanted to make a good impression – and somehow, I found an implementation. But of course, it wasn’t yet in any package.”
The next day, again over a meal, Boudt and Peterson decided to work together.
“A solution existed for value-at-risk, but not for expected shortfall, which is a better risk measure. So by applying the Cornish-Fisher expansion to estimate expected shortfall we developed a new risk measure. We published the paper in The Journal of Risk.”
library(PerformanceAnalytics)
# Equally-weighted portfolio with N=4 assets
N <- 4
data(edhec)
returns <- edhec[,1:N]
weights <- matrix(rep(1/N, N), ncol=1)
# Robust estimation of first four (co)moments
rets <- clean.boudt(returns)[[1]]
mu <- colMeans(rets)
sigma <- M2.shrink(rets)$M2sh
coskew <- M3.shrink(rets)$M3sh
cokurt <- M4.shrink(rets)$M4sh
# Compute 5% Cornish Value at Risk for equally-weighted portfolio
out <- PerformanceAnalytics:::VaR.CornishFisher.portfolio(0.05,
          weights, mu, sigma, coskew, cokurt)
# barplot visualization: portfolio VaR vs component contribution
barplot(c(out$MVaR ,out$contribution),
        names.arg = c("Portfolio VaR", colnames(rets)),
        col = c("blue", "orange", "darkgreen", "red", "purple"),
        main = "Cornish-Fisher Portfolio Risk Decomposition:
                Portfolio Value-at-Risk vs. Component Contributions")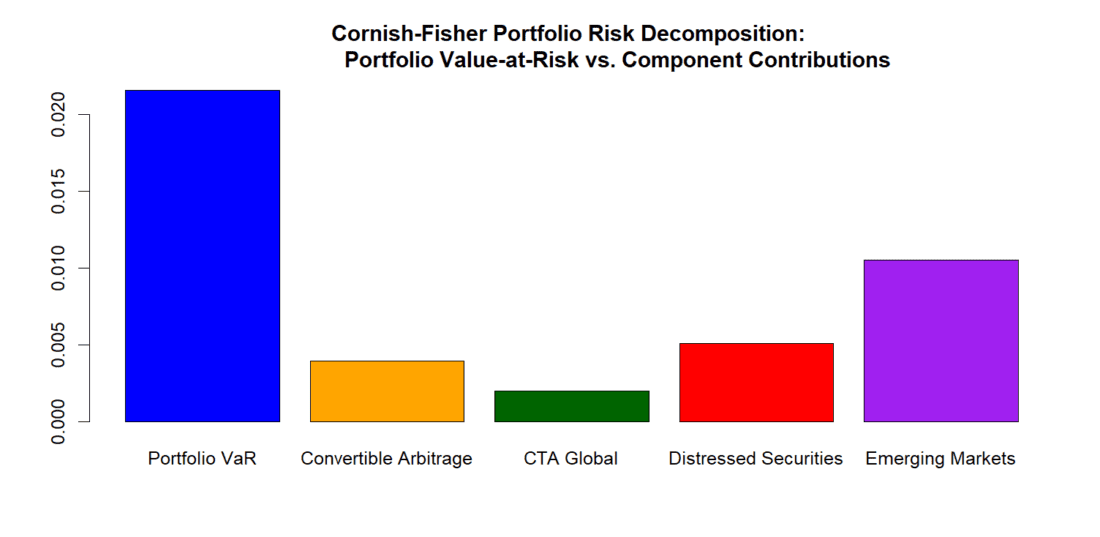
Source: Introduction to Portfolio Analysis in R – DataCamp
Paper: https://stat.ethz.ch/pipermail/r-help//2007-February/125841.html
Boudt says writing that paper while completing his PhD was one of the most productive times of his life.
“I worked European hours, and Brian worked US hours, so we were each working while the other was sleeping. The work informed my PhD, which I completed in two years and three months. It could be some kind of record.”
All of this came from that small R workshop in Switzerland. In addition to Peterson, Boudt also met Jeff Ryan and David Ardia.
“That’s what the R Finance conference is all about — forming and engaging with a community. You come together to solve problems. Everyone in the community is entrepreneurial because making a package is like making your own product. After Switzerland, Brian invited me to Chicago, where I became a guest professor at the University of Illinois. That’s when the next stage of my work began.”
Stay tuned for Part Three: Sentometrics, A Match Made in Belgium
The analysis in this material is provided for information only and is not and should not be construed as an offer to sell or the solicitation of an offer to buy any security. To the extent that this material discusses general market activity, industry or sector trends or other broad-based economic or political conditions, it should not be construed as research or investment advice. To the extent that it includes references to specific securities, commodities, currencies, or other instruments, those references do not constitute a recommendation by IBKR to buy, sell or hold such investments. This material does not and is not intended to take into account the particular financial conditions, investment objectives or requirements of individual customers. Before acting on this material, you should consider whether it is suitable for your particular circumstances and, as necessary, seek professional advice.
The views and opinions expressed herein are those of the author and do not necessarily reflect the views of Interactive Brokers, its affiliates, or its employees.


Join The Conversation
For specific platform feedback and suggestions, please submit it directly to our team using these instructions.
If you have an account-specific question or concern, please reach out to Client Services.
We encourage you to look through our FAQs before posting. Your question may already be covered!