
- Solve real problems with our hands-on interface
- Progress from basic puts and calls to advanced strategies
Interactive Options Course

Posted April 7, 2025 at 11:41 am
Kris Boudt, Professor, quant analyst, co-founder of Sentometrics, and devoted participant in Chicago’s annual Open Source Quantitative Finance Conference (formerly R/Finance), lights up when he speaks of the day his life changed.
“October 8, 2003. I was enrolled in an Erasmus exchange program and taking my first course in econometrics. One day, my professor came into the classroom dripping wet from the pouring rain, smiled, and said, ‘This is a beautiful day.’ We all stared at him. What was he talking about? It turned out that Robert Engle, who invented the GARCH model, had just received the Nobel Prize (GARCH is an acronym for Generalized AutoRegressive Conditional Heteroskedasticity, used to assess risk for assets that exhibit clustered periods of volatility in returns). I was only a third-year student and could not fully appreciate what this meant. But having in front of me a professor who was happy as a child that his field, financial econometrics, had just received this recognition convinced me on the spot about the importance of research and the value of recognition.”
library(quantmod)
library(rugarch)
# Obtain S&P 500 prices and compute daily returns
getSymbols("^GSPC", src="yahoo", from="1985-01-01" )
rets <- dailyReturn(GSPC[,6])
# Specify and estimate the GARCH model
garchspec <- ugarchspec( mean.model=list(armaOrder=c(0,0)),
                         variance.model=list(model="sGARCH",
                                             garchOrder=c(1,1)),
                         distribution.model="sstd")
garchfit  <- ugarchfit(garchspec, data=rets)
# Plot the predicted volatility
plot(sigma(garchfit), main = "Daily GARCH vol for the S&P 500")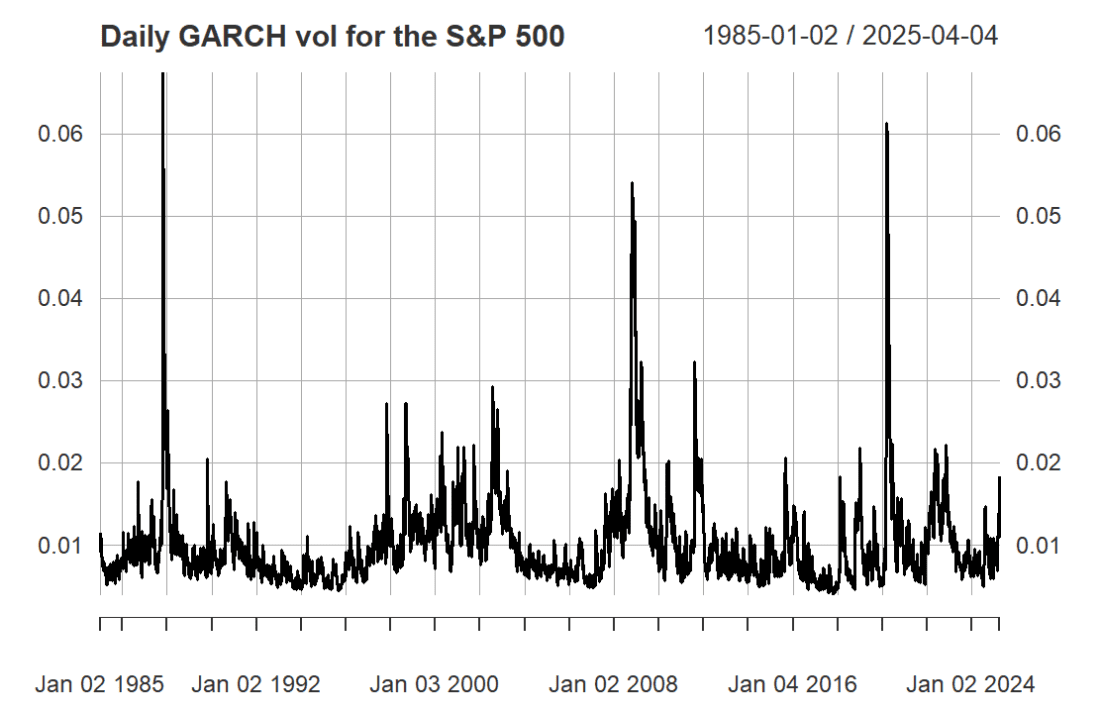
Source: GARCH Models in R – DataCamp
It was the first time Boudt had heard about the GARCH model and volatility.
“The model was published in 1982, and I was born in 1983, which felt kind of serendipitous. I decided pretty much right there to switch from business engineering to pure economics. I did my master’s thesis about using tick-by-tick high-frequency stock data to model volatility.”
The step from there to his PhD was relatively simple because his master’s thesis fed right into his dissertation. Serendipity played a significant role here as well: this was around the time when Olsen Financial Technologies made intraday foreign exchange data available to researchers.
“We started thinking about how to make sense of all that data. One of Robert Engle’s PhD students, Tim Bollerslev, was writing a lot about using high-frequency data. At the time, “high-frequency” meant five minutes. I was part of the wave that developed the models and methods.”
Boudt’s PhD supervisor, Christophe Croux, was a professor of Robust Statistics, a discipline grounded in the insight that pure data can’t be relied on without mediation because it always has outliers. Boudt was intrigued by the notion of developing methods that would account for outliers while delivering more reliable results.
“Robust Statistics is a very practical way of working with data, very solution-oriented. R was the primary language used for Robust Statistics, and very good open-source packages were already available. Professor Croux was encouraging but told me that if I developed a successful method, I also had to develop the code to run it.”
Boudt laughs.
“That taught me something important: most users don’t read papers. They’ll only trust your method if you give them the code and it works.”
Boudt’s supervisor next suggested he meet directly with other open-source code developers.
“It was great advice, really about building community. That’s how I found R/Finance.”
Stay tuned for Part Two: R/Finance Origins, From Switzerland to Chicago
The analysis in this material is provided for information only and is not and should not be construed as an offer to sell or the solicitation of an offer to buy any security. To the extent that this material discusses general market activity, industry or sector trends or other broad-based economic or political conditions, it should not be construed as research or investment advice. To the extent that it includes references to specific securities, commodities, currencies, or other instruments, those references do not constitute a recommendation by IBKR to buy, sell or hold such investments. This material does not and is not intended to take into account the particular financial conditions, investment objectives or requirements of individual customers. Before acting on this material, you should consider whether it is suitable for your particular circumstances and, as necessary, seek professional advice.
The views and opinions expressed herein are those of the author and do not necessarily reflect the views of Interactive Brokers, its affiliates, or its employees.


Join The Conversation
For specific platform feedback and suggestions, please submit it directly to our team using these instructions.
If you have an account-specific question or concern, please reach out to Client Services.
We encourage you to look through our FAQs before posting. Your question may already be covered!