
- Solve real problems with our hands-on interface
- Progress from basic puts and calls to advanced strategies
Interactive Options Course

Posted May 5, 2025 at 10:27 am
In the first installment of this series, Kris Boudt Part One: Quant Innovator, Professor, Entrepreneur, Kris discusses the day his life changed. In Kris Boudt Part Two: The R/Finance Conference, he talks about how the entrepreneurial spirit of The R/Finance Conference transformed quantitative analysis and had a significant impact on his life.
In 2012, quantitative research and development innovator Kris Boudt became a guest professor at the University of Illinois in Chicago, working with colleagues on portfolio applications with higher-order moments. He wasn’t yet familiar with the subject area his work would center on for the next 15 years.
“That’s when I took a course in sentiment analysis on corporate disclosures and news — seeing texts as a portfolio of features. The idea was to detect the relevant ones and build metrics out of that for financial applications.”
Boudt dove into the new field and, over the next several years, published papers that won awards and were cited in the New York Times. His entrepreneurial spirit led him toward creating a saleable product, but there were frustrations.
# Load required libraries
library(httr)
library(data.table)

# Retrieve list of available sentometrics indicators from the API
list_indices <- httr::GET(
  "https://api.sentometrics.com/public/timo/index"
)
list_indices <- httr::content(list_indices)
list_indices <- data.table::rbindlist(list_indices, fill=TRUE)

## Select the economic sentiment index for Belgium
idx <- list_indices[
  list_indices$friendly_name == "Economic Sentiment Indicator" &
    list_indices$friendly_frequency == "Daily" &
    list_indices$source == "Belgium"
]

## Retrieve historical values
idx_values <- httr::GET(
  sprintf(
    "https://api.sentometrics.com/public/timo/index/%i/values?from_date=%s",
    idx$id, # index's ID
    "2000-01-01" # starting date of the series
  )
)
idx_values <- httr::content(idx_values)
idx_values <- data.table::rbindlist(idx_values)
idx_values$timestamp <- as.POSIXct(idx_values$timestamp)

# Make the time series plot
plot(idx_values[order(timestamp)], type = "l", xlab="", ylab="",
     main = "Daily Economic Sentiment Time Series Belgium")
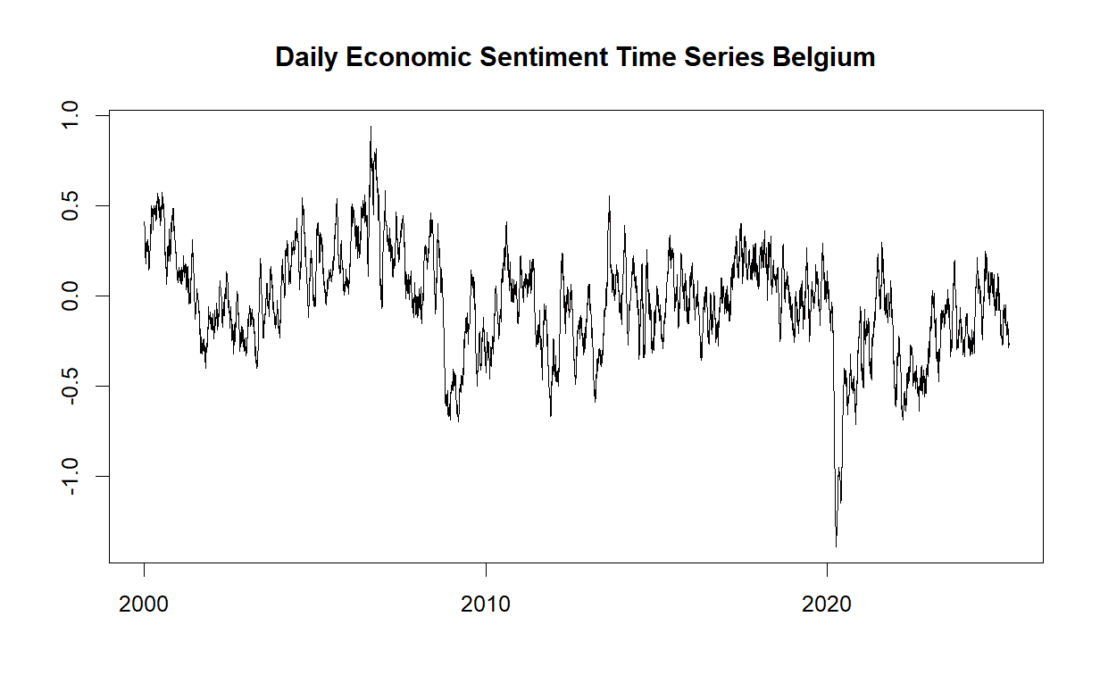
Source: Sentometrics
Open access papers:
https://onlinelibrary.wiley.com/doi/10.1111/joes.12370
https://www.sciencedirect.com/science/article/pii/S2950629825000086
https://www.sciencedirect.com/science/article/pii/S0169207018302036
“It’s easy to buy news data, but very difficult to get permission to develop a solution you can actually deploy. That requires API access to the daily news flow. We were able to convince our peers that the methods were useful – convince them sufficiently to win the awards. But we couldn’t take them further or apply them to create saleable solutions because the redistribution costs were too high.”
Seeking funding support, Boudt and his group participated in a speed matchmaking event in Brussels for Belgian companies to interact and seek common ground. One of his matches was with the Belgian news agency Belga.
“It was my most productive pitch ever. Within just five minutes we were making plans to work together. Over the next few weeks, we agreed on a win-win arrangement under which we would receive daily news data and would develop innovative solutions we could license out in a revenue-sharing arrangement.”
The result was Sentometrics, a joint venture with Belga.
“We develop products for the financial sector based on news data. We’re different from Bloomberg or Reuters because we cover all companies, not just public firms. That’s 800,000 Belgian companies from which we produce signals twice a day. We start with company numbers, using publicly available information to translate every company number into a query. Based on the query, we get the relevant articles, then use more standard sentiment analysis tools to see what the news is trying to tell us.”
Sentometrics organizes its products around themes such as healthcare, innovation, mergers, compliance, and ESG. Its biggest customers are commercial banks, who integrate the service into their CRM systems, and use it as an alternative kind of information for early warning risk models.
“Right now, we use very boring natural language processing because that’s what the publishers allow. What we’re not allowed to do is build large language models and use Generative AI. And yet, it works surprisingly well. Just like a carefully managed portfolio of boring stocks can outperform, we outperform because of how we construct the signals and integrate them into our customers’ workflow.”
Boudt notes that “getting the ‘how’ right” is critical.
“At university, for instance, one of my students was helping me teach statistics with R, and it wasn’t working. He said we should do it on a smartphone so students can continue their work at home whenever they want, 24 hours a day, seven days a week. So, while working on his PhD, he had the idea of creating the company DataCamp, which has actually changed how we teach data science.
The packages Kris has contributed to include:
The analysis in this material is provided for information only and is not and should not be construed as an offer to sell or the solicitation of an offer to buy any security. To the extent that this material discusses general market activity, industry or sector trends or other broad-based economic or political conditions, it should not be construed as research or investment advice. To the extent that it includes references to specific securities, commodities, currencies, or other instruments, those references do not constitute a recommendation by IBKR to buy, sell or hold such investments. This material does not and is not intended to take into account the particular financial conditions, investment objectives or requirements of individual customers. Before acting on this material, you should consider whether it is suitable for your particular circumstances and, as necessary, seek professional advice.
The views and opinions expressed herein are those of the author and do not necessarily reflect the views of Interactive Brokers, its affiliates, or its employees.

 for Daily Seasonal Data")


Join The Conversation
For specific platform feedback and suggestions, please submit it directly to our team using these instructions.
If you have an account-specific question or concern, please reach out to Client Services.
We encourage you to look through our FAQs before posting. Your question may already be covered!