
- Solve real problems with our hands-on interface
- Progress from basic puts and calls to advanced strategies
Interactive Options Course
Posted March 19, 2026 at 10:30 am
In many ways, the quintessential weather forecast is the high-temperature forecast issued in the morning for that day’s afternoon. It is of great interest because it is both highly variable and highly consequential for morning decisions in people’s personal lives and in industry and business.
For decades, these forecasts have been supported by physics-based numerical weather prediction models, enhanced with statistical corrections. However, recently, prediction markets have emerged as a potentially disruptive rival to the conventional methods.
Can prediction markets generate more accurate forecasts than the traditional mix of physics-based numerical weather prediction and statistical adjustments?
ForecastEx has been offering daily high-temperature markets via Interactive Brokers’ ForecastTrader since November 2025. I began systematically comparing ForecastEx’s prediction accuracy to traditional methods on March 11th, 2026, and the initial results are very positive for the prospect that prediction markets could already be the best source for today’s weather forecasts.
Prediction markets allow participants to take financial positions based on their expectations of the outcomes of well-defined events. They usually use state-price securities, in which a single contract pays $1 if a specific state occurs at a future time and $0 otherwise. For the daily high temperature, the event question can be phrased as: Will the high temperature today at a given location surpass X°F?
The market price of a contract at any given time reflects participants’ collective best estimate of the likelihood of that event occurring. For example, if a contract is trading at $0.70 for YES, that indicates a 70% chance of the event happening — in this case, a 70% probability that the high temperature will be above the temperature strike value at that location.
When evaluating whether prediction markets might outperform traditional daily weather forecasts, we must remember one key principle: prediction markets are not substitutes for standard forecasts; instead, they incorporate conventional forecast information as one input and convert it into refined probabilities through properly incentivized human judgment.
The structure strongly promotes accuracy because there is a direct financial reward for being accurate and a direct financial penalty for being inaccurate. This creates a dual effect of attracting accurate individuals and systems into the market while deterring those who are inaccurate. People or systems that consistently make poor forecasts are heavily motivated to either improve or leave the market.
Another advantage of prediction markets over traditional methods is their essentially ‘live’ update frequency (as long as markets remain liquid). In contrast, conventional weather forecasts update much less frequently, usually on multi-hourly schedules. In other words, prediction markets are naturally more responsive to real-time observations than traditional forecast cycles, which are commonly updated every six hours or in some cases, every hour.
Another aspect of improvement over conventional forecasts is that prediction market output is inherently probabilistic, whereas weather forecasts (for temperature at least) are often presented with no indication of the real uncertainty on the forecast. This probabilistic aspect is what makes prediction markets particularly useful for hedging against adverse weather scenarios.
I find that many people struggle to believe that prediction markets could improve on conventional methods, but I think this initial skepticism comes from a basic misunderstanding of what is being compared. People often picture two separate systems: one involving scientists, governments, and reputable businesses, and another involving uninformed speculators on apps for fun. Further, when money is so directly involved, some get a sense that something unseemly must be afoot, making them hesitant to trust the system.
But this mischaracterizes the situations in several ways. First, like all aspects of modern human activity, financial incentives also heavily influence conventional weather forecasts, so the two systems do not fundamentally differ in this respect. Second, it is precisely the more direct financial incentives in prediction markets that work to prune out inaccuracy. Third, as mentioned above, prediction markets do not operate as parallel competitors to conventional forecasting systems but rather are downstream of those systems, using information from those systems as input.
The above lays out the theory for why prediction markets might be expected to be more accurate than conventional forecasts, but whether this is true in this case is an empirical question amenable to testing. Below, I show initial results for just such a test.
I compare the ForecastEx prediction market forecast with the National Weather Service’s Localized Aviation Model Output Statistics Program (LAMP).
ForecastEx markets use official hourly Meteorological Aerodrome (METAR) reports from airport stations (as reported by WeatherUnderground). As such, National-Weather-Service-LAMP is the most directly comparable conventional forecast system because it has versions targeting the same weather stations, at an hourly cadence, enabling an apples-to-apples timescale and spatial scale comparison.
More specifically, National-Weather-Service-LAMP combines guidance from large-scale numerical weather prediction models and historical biases between these models and each weather station to produce forecasts directly for these stations (as opposed to large grid boxes). Additionally, National-Weather-Service-LAMP updates and recalculates its forecasts hourly, among the fastest available update frequencies for conventional forecasting systems.
As mentioned above, ForecastEx does not directly produce a single forecast high temperature; rather, it provides a set of contracts at various temperature strikes, where each contract price indicates the likelihood that the daily high will surpass that strike. For example, for one city and day, you might see a strike ladder like: probability of exceeding 69°F, 70°F, 71°F, 72°F, and so on. Thus, in order to compare accuracy between ForecastEx and National-Weather-Service-LAMP, I need to convert ForecastEx exceedance probabilities into a central estimate. There is not a single way to do this, but I take what I think is the most straightforward approach: The 50% exceedance level represents the market-implied median high. If the strike ladder brackets that 50% crossing cleanly, I interpolate between adjacent strikes to estimate the implied central value in degrees Fahrenheit and round it to the nearest whole value. If the ladder does not bracket the center (for example, if all listed strikes imply very high or very low exceedance), I treat the central estimate as unavailable rather than extrapolating beyond the quoted ladder. In effect, this situation indicates a technical problem with the prediction market strike listing as currently configured, and shouldn’t count against participants’ performance.
With the central ForecastEx value in hand at any given time, I can sample it hourly, which matches the native timescale of the National-Weather-Service-LAMP forecasts, enabling an apples-to-apples comparison. The hourly timescale also aligns with the native timescale of the observational METAR reports from airport stations that both systems target.
The figure below illustrates the comparison for Los Angeles on March 17th, 2026.
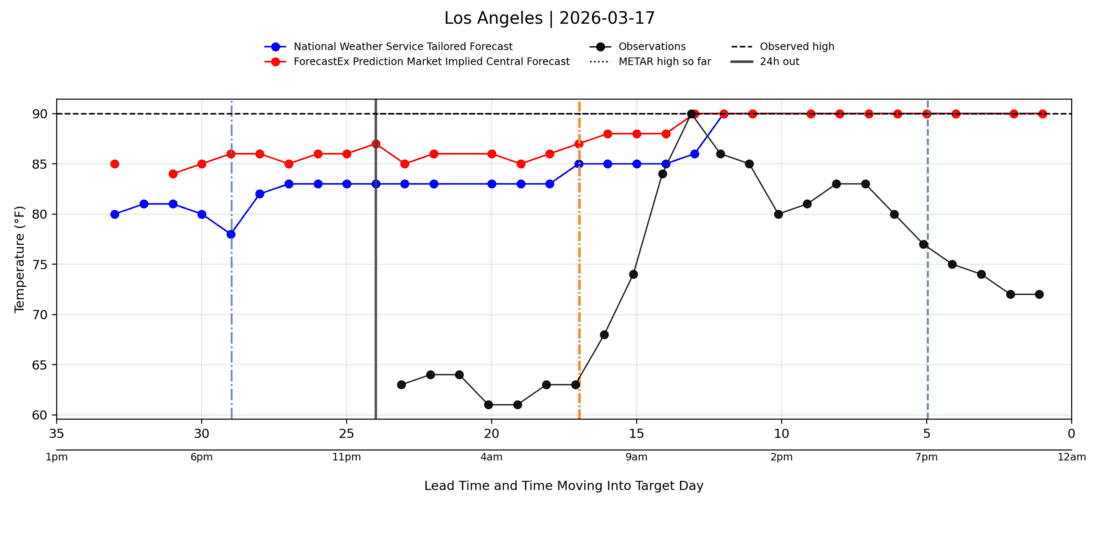
Figure produced with Python Matplotlib.
The blue and red lines are the National-Weather-Service-LAMP and ForecastEx forecasts of the daily high temperature (respectively), corresponding to each hour of the day and extending into the previous day (March 16th). These are not the predicted temperatures for each hour, but rather what each system predicts for the daily high temperature on March 17th (whenever that might occur) at that hour. In other words, the value of 86°F at 8:00 pm on the 16th indicates that ForecastEx was predicting a daily high temperature of 86°F sometime on the 17th.
The black line indicates hourly METAR observations, and they do, in fact, reflect the actual observed temperature for each hour. The black dotted horizontal line marks the eventual observed daily high. In essence, the better the forecast, the longer the time spent closer to the horizontal dashed line.
In this case, the eventual high on the target day was 90°F. In the evening before the target day, ForecastEx was more accurate than National-Weather-Service-LAMP, predicting the upper 80s, while National-Weather-Service-LAMP was in the lower 80s. As the rapid-heating portion of the day approached, ForecastEx was quicker to adjust, raising its central forecast from 85°F at 5:00 am to 87°F by 8:00 am and 90°F by 11:00 am, when the high was realized.
National-Weather-Service-LAMP was behind in terms of both its absolute error and the speed with which it adjusted to observations. At 11:00 am, when the observed temperature was 90°F, National-Weather-Service-LAMP was still predicting a high of 86°F.
National-Weather-Service-LAMP ingests the most recent observations and recalculates its forecast every hour, but it does not appear to do so as effectively as prediction market participants.
That’s a single example, but this pattern is generally present across the 23 cities, and 7 days (161 city-days) I have tracked so far.
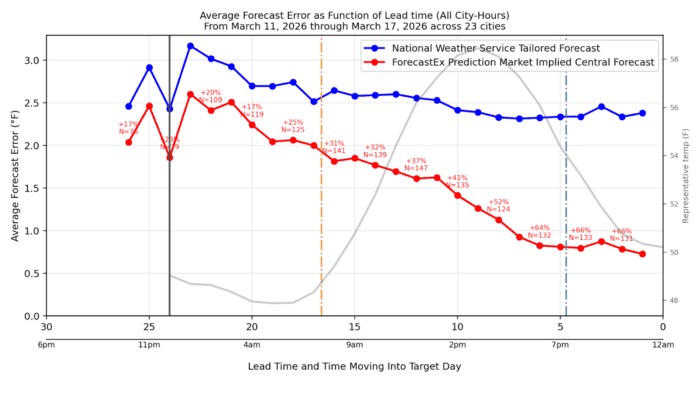
Below are the results aggregated over all city days since I began formally recording this (March 11th 2026). In the plot below, however, rather than the actual temperature on the Y-axis, I show the average absolute error between the forecasting system’s predicted high and the eventual actual high as a function of lead time progressing through the end of the target day.
A value of zero would mean zero error and would thus be a perfect forecast. Also shown are the percent differences in accuracy between ForecastEx and National-Weather-Service-LAMP for each lead time (where positive indicates ForecastEx is more accurate), along with the sample size (N).
A secondary grey curve shows the average of the daily temperature progression, and average sunrise and sunset are shown for context.

Figure produced with Python Matplotlib.
The figure indicates that ForecastEx and National-Weather-Service-LAMP have average errors between 2°F and 3°F in the late evening before the target day, but ForecastEx is roughly 20% more accurate. As we move into the target day, errors for both systems decrease, with ForecastEx showing a greater reduction and being about 40% more accurate in the hours leading up to the typical time of the high temperature.
I disaggregate this information into individual locations in the map below, which shows the average errors for both systems over the date range (March 11th through March 17th), pooled over the 5:00 am to noon local hours. We can see that ForecastEx is showing improvement over National-Weather-Service-LAMP in 19 out of 23 cities, with a median improvement of over 26%. It is an open question whether this geographic variation represents noise or something more systematic.
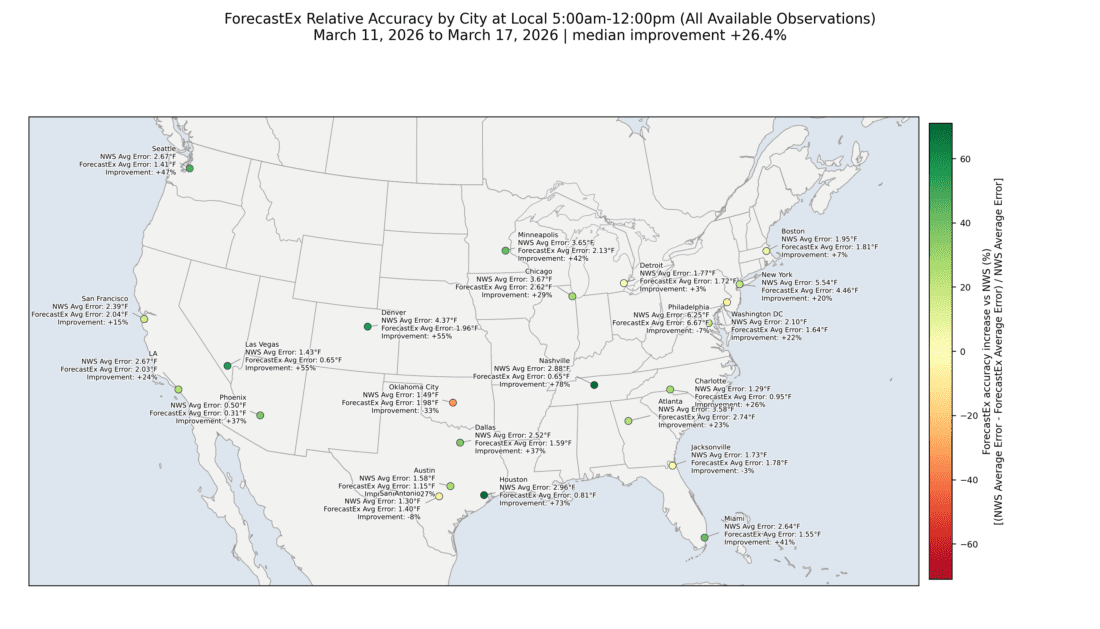
Figure produced with Python Matplotlib.
Daily weather forecasting is one of the most mature, established, and scientifically principled fields of science and industries. It is not an exaggeration to describe conventional weather forecasting systems as the frontier of applied physics, statistics, and computer science, resting on decades, if not centuries, of scientific inquiry.
As such, conventional weather forecasts should hardly represent a target ripe for a novel forecasting system to improve upon.
Specifically, the conventional system discussed here, the National Weather Service’s Localized Aviation Model Output Statistics Program (National-Weather-Service-LAMP), is designed specifically to provide highly localized, short-range forecasts for the specific weather stations in question. Because of this, anything that can match or improve upon National-Weather-Service-LAMP in out-of-sample testing is a significant achievement.
Despite the formidable challenge, preliminary evidence indicates that the ForecastEx prediction markets are doing just that. I am seeing that the markets are not just echoing public forecasts but aggregating dispersed information in a way that improves upon sophisticated established systems.
This is just the beginning of this tracking, and I plan to provide regular updates. However, if this pattern continues on a larger scale, it is a significant discovery that shows prediction markets genuinely improve forecasts, even in a highly scientific and mature field such as weather forecasting.
The analysis in this material is provided for information only and is not and should not be construed as an offer to sell or the solicitation of an offer to buy any security. To the extent that this material discusses general market activity, industry or sector trends or other broad-based economic or political conditions, it should not be construed as research or investment advice. To the extent that it includes references to specific securities, commodities, currencies, or other instruments, those references do not constitute a recommendation by IBKR to buy, sell or hold such investments. This material does not and is not intended to take into account the particular financial conditions, investment objectives or requirements of individual customers. Before acting on this material, you should consider whether it is suitable for your particular circumstances and, as necessary, seek professional advice.
The views and opinions expressed herein are those of the author and do not necessarily reflect the views of Interactive Brokers, its affiliates, or its employees.
Interactive Brokers LLC is a CFTC-registered Futures Commission Merchant and a clearing member and affiliate of ForecastEx LLC (“ForecastEx”). ForecastEx is a CFTC-registered Designated Contract Market and Derivatives Clearing Organization. Interactive Brokers LLC provides access to ForecastEx Forecast Contracts for eligible customers. Interactive Brokers LLC does not make recommendations with respect to any products available on its platform, including those offered by ForecastEx.
This is commentary on economic, political and/or market conditions within the meaning of CFTC Regulation 1.71, and is not meant provide sufficient information upon which to base a decision to enter into a derivatives transaction.
Related Articles


Join The Conversation
For specific platform feedback and suggestions, please submit it directly to our team using these instructions.
If you have an account-specific question or concern, please reach out to Client Services.
We encourage you to look through our FAQs before posting. Your question may already be covered!