
- Solve real problems with our hands-on interface
- Progress from basic puts and calls to advanced strategies
Interactive Options Course
Posted February 4, 2026 at 12:30 pm
Why the National Weather Service Time Series Viewer, National Weather Service Official Daily Climatological Report, and Hourly METAR Values Can Differ.
Participants in the ForecastEx daily temperature markets (as well as analogous markets on other exchanges) will notice a common apparent discrepancy between data sources purporting to represent the same data.
In particular, the temperature shown on the National Weather Service Time Series Viewer will not necessarily match the eventual high (or low) reported in the official National Weather Service Daily Climatological Report (CLI), nor the highest or lowest hourly temperature reported by WeatherUnderground, which are derived from METAR reports at airport stations. This can cause frustration because the National Weather Service time-series viewer is the most commonly used data stream for observing how temperatures are evolving during a trading day, whereas the latter two sources (National Weather Service Daily Climatological Report and Hourly METAR Reports) are used for definitive contract resolution at ForecastEx and on other exchanges.
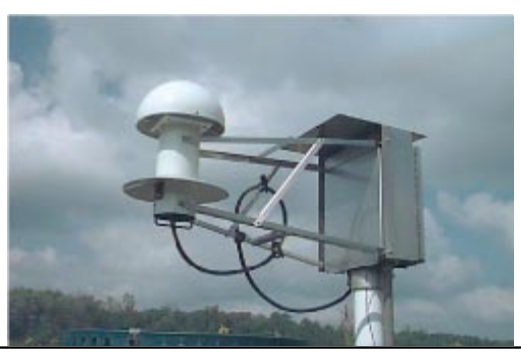
All three data sources correspond to the same weather stations, typically ASOS stations at airports. Therefore, discrepancies do not arise from different data sources. Rather, they tend to arise from systematic differences in how data is processed between the three sources.
The figure below illustrates how the discrepancies come about using synthetic data.
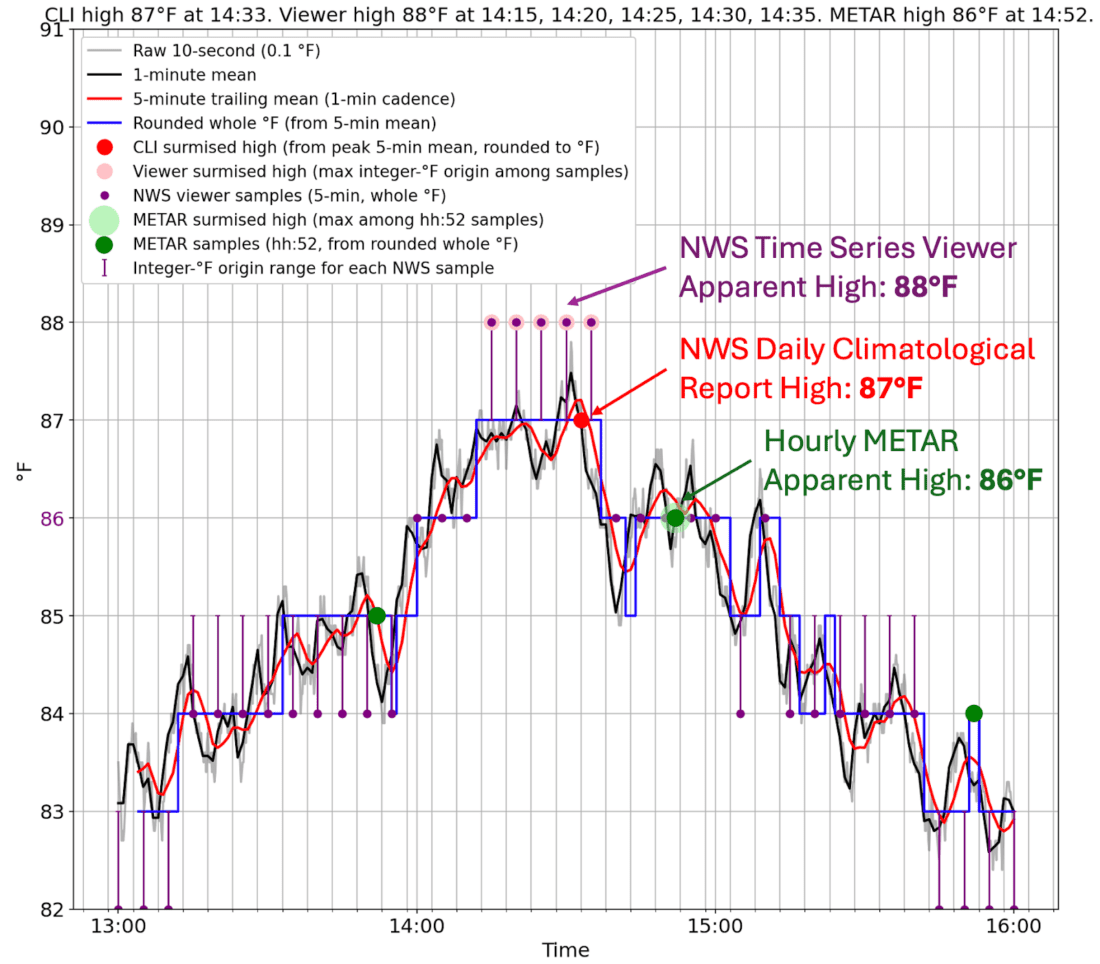
Figure created with Python Matplotlib
The grey line in the background represents raw hygrothermometer measurements from the ASOS stations, with a 10-second sampling interval and 0.1°F precision.
However, for the purposes of determining a daily high or low temperature, the meteorological convention is that an extreme must persist for more than 10 seconds. Thus, these 10-second samples undergo two levels of temporal averaging before they are considered eligible for determining the official high or low reported by the National Weather Service Daily Climatological Report.
First, for each minute, the 10-second samples within that minute (as long as at least 4 are reported) are averaged to produce a single value per minute. This is the black line above.
Second, these 1-minute values are smoothed using a 5-minute boxcar moving average. Each minute is assigned one of these 5-minute averages, computed from the preceding minutes. This is shown by the red line above.
Additionally, the National Weather Service reports daily high and low temperature extremes in rounded whole-degree °F values. This is shown with the blue line above.
Thus, the blue line shows the high temperature that the official National Weather Service Daily Climatological Report will likely report, with the time of occurrence corresponding to the time when the 5-minute rolling mean reached its maximum, rounded to the nearest whole minute. This is shown with the red dot.
Then there are the hourly METAR (Meteorological Aerodrome Report) reports. These report temperature to the nearest tenth of a degree Celsius, corresponding to a precision of 0.18 degrees Fahrenheit, and are typically recorded near 52 minutes past the hour. These METAR values are converted back into Fahrenheit and rounded to the nearest whole °F value. Thus, for the purposes of these markets, the METAR reports are effectively sampling from the blue line. However, their sampling frequency is low: they are typically produced only once per hour, which can result in missing any extremes that occur within the hour.
Got that so far? Because things get a little strange when it comes to the National Weather Service Time Series viewer (purple dots).
Because Celsius is the more scientifically conventional unit and is also more commonly used in the aviation industry, the default automation systems that transmit temperature data from ASOS stations convert whole °F values (blue line) to whole °C values before transmission. However, when these whole °C values arrive at the National Weather Service systems, they are convert them back to whole °F values because that’s the unit Americans and the agency prefer.
This creates ambiguity because one °C equals 1.8 °F, so most whole °C values could represent two possible whole °F values.
For example, 87°F converts to 30.6°C, which rounds to 31°C.
But, 88°F converts to 31.1°C, which also rounds to 31°C!
31°C converts back to 87.8 °F which rounds to 88°F.
This 88°F would be what the National Weather Service Time Series viewer would show. However, critically, the displayed 88°F could have originated from either 87°F or 88°F in the original data stream.
This ambiguity, arising from passing values through a whole-degree Celsius mapping, is indicated by the purple error ranges in the figure above.
You’ll notice that there are no error ranges on the value 86°F. That’s because some Fahrenheit values convert exactly to an integer Celsius value. When that happens, rounding in Celsius does not create ambiguity, as no neighboring Fahrenheit values yield that same Celsius result. 86°F, for example, converts to exactly 30.0°C and no other whole °F value would (85°F converts to 29°C rounded and 87°F converts to 31°C rounded).
These special ‘no-ambiguity’ Fahrenheit values are spaced regularly, at every 9°F: 68, 77, 86, 95, and so on. So, when a market participant sees one of these special values as the day’s minimum or maximum in the time series viewer, they should note that it is much more likely than one of the ambiguous values to end up being the official high or low as determined by the National Weather Service’s daily Climatological Report.
So, in the figure above, there is a period of about half an hour during which the 5-minute rolling mean time series (red line) rounds to 87°F (blue line). However, after these values pass through Celsius conversion (30.6°C), rounding (31°C), Fahrenheit conversion (87.8°F), and another round of rounding (88°F), the final value is displayed as 88°F. Furthermore, time-series viewers typically display values at 5-minute intervals, so there are five 88°F values shown. Also, this peak in temperatures occurs between METAR reports, so an extra degree was missed at their hourly sampling resolution.
In this example, the three data sources would indicate a different high temperature. The NWS Time Series Viewer would indicate 88°F, the NWS Daily Climatological Report would indicate 87°F, and the maximum of the hourly METAR reports would indicate 86°F.
These discrepancies arise from systematic differences in how data are processed, and skilled traders should be aware of them to maximize the chances of success in the daily weather markets.
Summary of three data reports:
For specific platform feedback and suggestions, please submit it directly to our team using these instructions.
If you have an account-specific question or concern, please reach out to Client Services.
We encourage you to look through our FAQs before posting. Your question may already be covered!
The analysis in this material is provided for information only and is not and should not be construed as an offer to sell or the solicitation of an offer to buy any security. To the extent that this material discusses general market activity, industry or sector trends or other broad-based economic or political conditions, it should not be construed as research or investment advice. To the extent that it includes references to specific securities, commodities, currencies, or other instruments, those references do not constitute a recommendation by IBKR to buy, sell or hold such investments. This material does not and is not intended to take into account the particular financial conditions, investment objectives or requirements of individual customers. Before acting on this material, you should consider whether it is suitable for your particular circumstances and, as necessary, seek professional advice.
The views and opinions expressed herein are those of the author and do not necessarily reflect the views of Interactive Brokers, its affiliates, or its employees.
Interactive Brokers LLC is a CFTC-registered Futures Commission Merchant and a clearing member and affiliate of ForecastEx LLC (“ForecastEx”). ForecastEx is a CFTC-registered Designated Contract Market and Derivatives Clearing Organization. Interactive Brokers LLC provides access to ForecastEx Forecast Contracts for eligible customers. Interactive Brokers LLC does not make recommendations with respect to any products available on its platform, including those offered by ForecastEx.
This is commentary on economic, political and/or market conditions within the meaning of CFTC Regulation 1.71, and is not meant provide sufficient information upon which to base a decision to enter into a derivatives transaction.
Related Articles


 News")


I see that for 12 Feb, forecast trade resolution use weather underground for resolutoin, may I know if its one-off or permanent? Thanks.
While you didn’t mention it one way or the other, your graph might be interpreted as suggesting that when the 10-second readings of 0.1 º F precision are averaged to get a value for the whole minute interval, that the average is also recorded with 0.1º F precision, and from what I have read it is not. It seems like that value is rounded and stored as whole degrees F.
This also fails to point out that METARS do contain T codes or remarks that do capture the true high. Weather underground pulls an API from the weather company called v2/pws/current conditions. It essentially pulls the current conditions from the METAR and ignores the t codes which contain 24 hour highs and 6 hour highs throughout the day. NWS 5 minute observations end of matching the METAR at code remarks. The time series does also display these t codes. You just need to know where to look. NWS,METAR, and the climatology report will match one another 99% of the time unless a human has to audit the data for some reason. Weather underground will miss the high 50% of the time. It will also have a bias towards the under. It’s off by -1 degrees most the time. I’ve observed it being off by up to -3 degrees!
Yeah the event question is will the temperature at the station be higher than ##? Weather underground can’t even match the temperatures recorded at the weather stations they represent in the contract. They stated in a notice to members that the WU relies on METARS which is half true based on what you said. They don’t even pull data from the stations themselves? They pull it from the a weather company API I wish they would’ve told us that I wouldn’t have been using the METARS to lose my money. I would’ve just said okay this is actually an event contract who’s event should be: what will the daily high be reported as by weather underground for this station on this date?
Сейчас сеть является жизненно важной частью нашей повседневности.
Он даёт быстрый доступ к колоссальному объёму данных.
За счёт всемирной паутине мы в состоянии взаимодействовать с друзьями и коллегами в любом месте планеты.
В сфере труда, обучения и бизнеса интернет превратилась в главный инструмент.
https://www.pinterest.com/pin/154952043426454346/
Кроме того, он предлагает бесконечные варианты для отдыха и личностного роста.
При отсутствии интернета в современном мире сложно представить как домашние, так и профессиональные задачи.
Именно поэтому наличие к стабильному сетевому соединению считается фундаментальной необходимостью современного человека.