
- Solve real problems with our hands-on interface
- Progress from basic puts and calls to advanced strategies
Interactive Options Course

Posted January 8, 2026 at 10:00 am
Dear Investor,
Are you already looking forward to the Football World Cup, or do you lean more toward winter sports and the Olympic Games? Do such events – often said to coincide with the passage of unpopular political decisions – actually have any impact on stock prices in Germany? Or might it be more effective to focus on the decennial cycle to improve investment outcomes?
In this edition of Seasonal Insights, we examine all of these perspectives and develop a coherent strategy from them.
Since the FIFA World Cup in Qatar, at the very latest, we know that this major event doesn’t necessarily have to take place in the summer of our hemisphere. Therefore, this period is not suitable for an explicit analysis. Nevertheless, it’s worthwhile to look at the years in which such tournaments have been held.
Looking at the last 16 years in which a men’s FIFA World Cup has taken place, two periods stand out. The first extends from April to October. A pronounced downward trend is immediately apparent here. This trend is particularly striking at 3 to 13 years, and the performance achievable with a short position during this period is also impressive at over 17%.
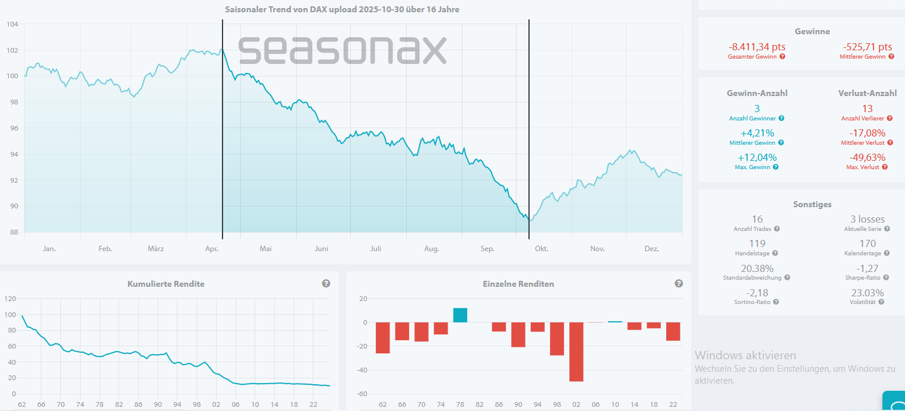
The second period follows directly after the phase just described. Over a significantly shorter period, namely from October to December, an average return of just under 10% can be expected, with a success rate of 12 to 4 years. Setting the stop-loss at 5% for both periods results in a very good overall chance of success with the statistics of this event.
Regarding the timeframe, the Winter Olympics necessarily always take place in winter. One could therefore argue that the annual cycle of a Winter Olympics year must be identical to that of a men’s FIFA World Cup. This has been the case since 1994. Before that, the Winter Games always took place in the same year as the Summer Games. For this reason, we also examined these years prior to 1994 in the corresponding four-year cycle.
The period in which the Winter Games take place shows no particular anomalies, which is why it can be disregarded.
It is not particularly surprising that this chart is quite similar to that of the football event. However, the time periods are shorter, but they fit the behavior just described.
From mid-August to early October, a short position can generate an average return of around 9% over 12 corresponding downward price movements. However, this high average performance is primarily driven by the years 1998 and 2002.
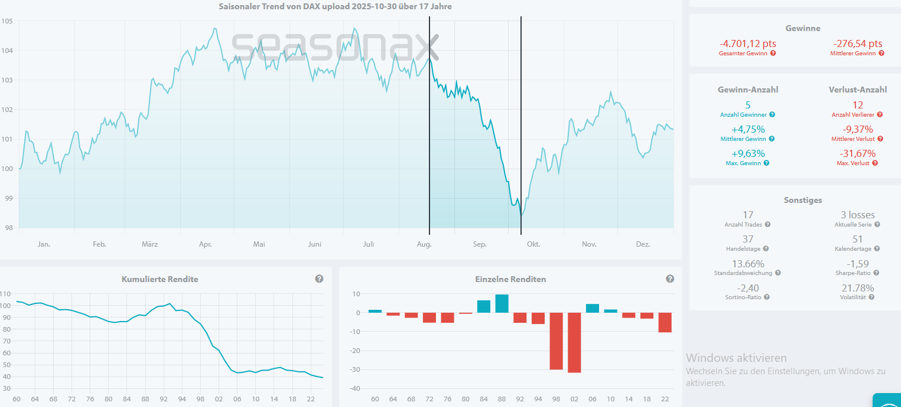
The positive phase, which directly follows the downward phase, lasts only until November and boasts a favorable ratio of 11 to 6. In these positive years, an average return of around 9% is expected. However, the years described above again contribute significantly to the overall performance.
It’s certainly debatable whether sporting events have an impact on the stock market. While the figures just presented partially support this, they are of course no guarantee for future events.
Many market participants look at the decadal cycle each year. This involves examining each decade in relation to its respective years. The upcoming year ends in the year 6, so all these years have been grouped together and a corresponding average calculated.
For the DAX, 60 years of data are available for analysis (calculated retrospectively). The resulting six years ending in a 6 all had negative performances between April and July. On average, losses of around 10% were recorded during these periods. However, the years 1966 and 1986 are particularly responsible for this high average.

From July to September, this statistic shows an upward trend with a ratio of 5 to 1. On average, a good 8% could be earned here.
For more meaningful statistics, however, one should consider an even longer period. This is possible with the S&P 500, where the statistics of the FIFA World Cup (even though it is being held in the USA this year) are likely to be of less interest, since soccer does not have the same status as a sport in the United States as it does in European countries.
Of the nine years ending in a 6, a positive trend is evident from mid-January to mid-April. This period, with eight positive years, averages an average return of almost 9%.
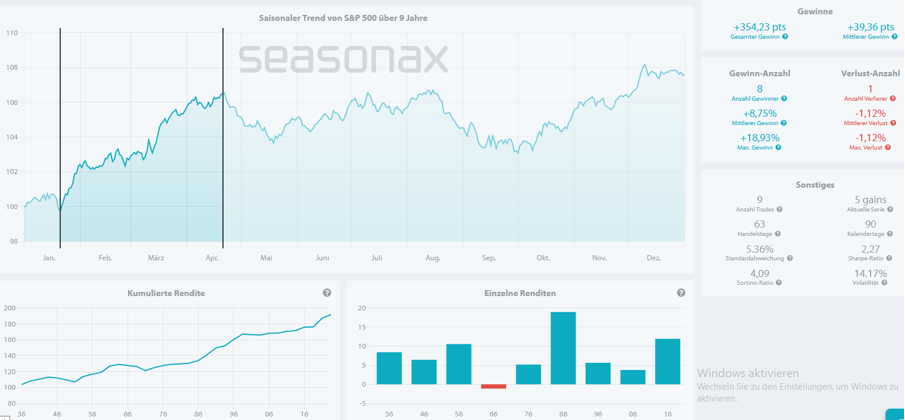
From August to October, a downward trend sets in again, although the statistics are not particularly pronounced. Nevertheless, the 3-to-6-year pattern shows an average of almost 8% in the negative years.
All the events considered so far show a more or less pronounced downward trend during the summer months of the current year. This means that one should either consider short positions or at least set stop-loss levels for existing positions.
Also noteworthy is the start of the year, which should still be quite positive and could thus fuel a certain carelessness for the summer.
With the start of the statistical year-end rally, all events show the same or at least a similar pattern.
Therefore, the coming year is likely to bring major challenges, which should be exploited, or at least managed, through the cycles described here.
Even though these analyzed cycles may not seem to have much to do with each other at first glance, it turns out that there are certain overlaps that lead to greater certainty in the assessment of future developments.
This approach can increase performance and significantly improve the probability of a successful trade.
Benefit from Seasonax while keeping an eye on the major sporting events ahead.
Take advantage of the events coming up this year. Or simply follow the sporting events and remember the decade cycle when making your investments.
—
Originally Posted January 7, 2026 – How Football, Winter Sports, and Decades Relate to the Stock Market
Past results and past seasonal patterns are no indication of future performance, in particular, future market trends. Seasonax GmbH neither recommends nor approves of any particular financial instrument, group of securities, segment of industry, analysis interval or any particular idea, approach, strategy or attitude nor provides consulting nor brokerage nor asset management services. Seasonax GmbH hereby excludes any explicit or implied trading recommendation, in particular, any promise, implication or guarantee that profits are earned and losses excluded, provided, however, that in case of doubt, these terms shall be interpreted in abroad sense. Any information provided by Seasonax GmbH or on this website or any other kind of data media shall not be construed as any kind of guarantee, warranty or representation, in particular as set forth in a prospectus. Any user is solely responsible for the results or the trading strategy that is created, developed or applied. Indicators, trading strategies and functions provided by seasonax GmbH or on this website or any other kind of data media may contain logical or other errors leading to unexpected results, faulty trading signals and/or substantial losses. Seasonax GmbH neither warrants nor guarantees the accuracy, completeness, quality, adequacy or content of the information provided by it or on this website or any other kind of data media. Any user is obligated to comply with any applicable capital market rules of the applicable jurisdiction. All published content and images on this website or any other kind of data media are protected by copyright. Any duplication, processing, distribution or any form of utilisation beyond the scope of copyright law shall require the prior written consent of the author or authors in question. Futures and forex trading contains substantial risk and is not for every investor. An investor could potentially lose all or more than the initial investment. Risk capital is money that can be lost without jeopardizing ones’ financial security or lifestyle. Only risk capital should be used for trading and only those with sufficient risk capital should consider trading. Past performance is not necessarily indicative of future results. Testimonials appearing on this website may not be representative of other clients or customers and is not a guarantee of future performance or success.
Information posted on IBKR Campus that is provided by third-parties does NOT constitute a recommendation that you should contract for the services of that third party. Third-party participants who contribute to IBKR Campus are independent of Interactive Brokers and Interactive Brokers does not make any representations or warranties concerning the services offered, their past or future performance, or the accuracy of the information provided by the third party. Past performance is no guarantee of future results.
This material is from Seasonax and is being posted with its permission. The views expressed in this material are solely those of the author and/or Seasonax and Interactive Brokers is not endorsing or recommending any investment or trading discussed in the material. This material is not and should not be construed as an offer to buy or sell any security. It should not be construed as research or investment advice or a recommendation to buy, sell or hold any security or commodity. This material does not and is not intended to take into account the particular financial conditions, investment objectives or requirements of individual customers. Before acting on this material, you should consider whether it is suitable for your particular circumstances and, as necessary, seek professional advice.
Related Articles


Join The Conversation
For specific platform feedback and suggestions, please submit it directly to our team using these instructions.
If you have an account-specific question or concern, please reach out to Client Services.
We encourage you to look through our FAQs before posting. Your question may already be covered!