- Solve real problems with our hands-on interface
- Progress from basic puts and calls to advanced strategies
Interactive Options Course
Posted October 2, 2026 at 11:00 am
By Josh Hemmerling & Patrick Brown
Hurricane Ian formed just north of Venezuela on Friday, September 23rd, 2022, and a few days later it became clear it would impact the United States.
In the early morning of Monday, September 26th, 2022, it had progressed north into the middle of the Caribbean Sea and was forecast to strengthen dramatically and make landfall somewhere on Florida’s west coast.
The forecast cone of uncertainty was still relatively large at that point. For the Florida Gulf Coast, forecasters knew high winds were likely somewhere, but the chance of high winds at any given location was still modest.

Figure 1: The National Hurricane Center’s forecast cone for Ian, issued 2 AM EDT (06:00 UTC) on Monday, September 26, 2022. The cone shows the probable path of the storm’s center (not its size), and at this hour it covered a great deal of Florida’s west coast. Source: NWS National Hurricane Center.
Consider a homeowner in Sarasota, FL, who was within the hurricane’s cone of uncertainty at that time. Until that morning, she had hardly thought about her home insurance deductible. It was a line in a policy she signed years ago. In the span of a couple of days, however, it became a real possibility that her home would experience major damage and she would be on the hook for her deductible.
The questions before her were whether the winds from the storm would be strong enough to cause major damage and what, if anything, she could do about it.
If they were available at the time, Live Hurricane contracts listed at ForecastEx could have been used to address both questions.
These prediction market event contracts have questions phrased like “Will Hurricane Ian cause wind gusts of 100 mph or greater in Sarasota, FL?”
Each contract is a yes-or-no question, and it pays $1 if the answer turns out to be yes and $0 if it turns out to be no. The price you pay for a yes, in cents, is the market’s implied estimate of the chance. A contract at 13¢ can be interpreted as a 13% chance and pays $1, about 7.7 times the money put up, if it settles yes. If it settles no, the 13¢ is lost and transferred to whoever sold the yes (or equivalently bought the no).
The contracts in this thought experiment ask one question over and over at different wind speeds: will the peak gust at this city reach X mph or more? Statisticians call that an exceedance probability. X runs in 10 mph steps, and each step is its own contract with its own market and price. Line them up and you have a ladder. The higher the rung, the less likely the wind is to reach it, so the yes contract is cheaper, and the yes payout multiple is larger.
The rungs are not mutually exclusive, and they stack, so if the wind at Sarasota settles at 137 mph, that clears 130, which means it also cleared 120, 110, 100, 90, and 80, and every one of those contracts pays $1 for the ‘yes’. Thus, a position spread across the ladder pays more, rung by rung, as the storm gets worse.
The ForecastEx Live Hurricane contracts are supported by the tropical cyclone risk analytics firm Reask, which also provides forward-looking probabilistic forecasting of wind gusts at the contracts’ defined locations and thresholds. Since these Live Hurricane markets did not exist in 2022, the analysis below uses Reask probabilistic forecasts as a surrogate for what the live price in the market may have looked like at any given time leading up to Hurricane Ian’s landfall.
Using these Reask forecasts retrospectively applied to Hurricane Ian in the early morning of Monday, September 26th, 2022, Sarasota had an 86% chance of seeing 60 mph gusts, a 49% chance of 90 mph, and a 20% chance of 120 mph.
Our hypothetical homeowner could have looked at the contracts and seen something her insurance policy never offered: a way to hedge against her insurance deductible itself.
Most homeowner insurance policies in Florida carry a separate hurricane deductible set as a percentage of the insured value of the house, commonly 2%, with 5% and 10% options (Blaise Ingoglia). Let’s imagine our homeowner’s house is insured for $1,000,000, so her 2% deductible is $20,000. That’s $20,000 out of her pocket before the policy begins paying.
Say the storm takes her roof and the replacement costs $50,000. Her insurer covers $30,000, and she writes a check for the remaining $20,000. If the roof costs $80,000 instead, the insurer covers $60,000, and she still pays $20,000. The deductible doesn’t move or depend on how bad the storm is, which keeps small claims off the insurer’s books and enables them to charge lower premiums overall.
Despite the deductible’s benefit on premiums, that $20,000 gap is something our homeowner may want to mitigate.
She could consult the National Weather Service’s wind impact scale and find that it starts discussing roofs coming completely off if wind gusts reach 130 to 150 mph. So let’s imagine she assumes winds at that level would damage her $50,000 roof enough that she would certainly have to pay her full $20,000 deductible.
She then looks at the ladder of Live Hurricane contracts and sizes her position so a storm reaching 150 mph returns exactly $20,000, then works backward. She ends up buying contracts for $7,157, spread across eight rungs of the exceedance ladder, 10 mph apart, from 80 up to 150.
She starts the ladder at 80 mph because the National Weather Service’s wind impact scale predicts damage to roofing and siding material at that speed, with outright roof loss beginning to emerge as a small but real possibility.
She thinks about it as a chance that starts near zero around 80 mph and climbs with every rung above it, which is why she buys in 10 mph steps instead of putting everything on one rung.
She puts the most money on the bottom rung and the least on the top (bottom and top in terms of wind speed). The bottom rung is the most likely to pay and thus pays the least per contract; the top rung is the least likely but pays twenty to one. That produces a payout that starts small and likely, then climbs into the outcomes that cost the most money, a shape laid out in Figure 2.
Table 1a. Sarasota, $7,157 ladder, September 26 06:00 UTC prices, settled 137.3 mph
| Threshold | Stake | Share | Price | Payout multiple | Contracts | Cost | Paid? | Received |
|---|---|---|---|---|---|---|---|---|
| ≥ 80 mph | $1,718 | 24% | 61¢ | 1.64x | 2,816 | $1,718 | yes | $2,816 |
| ≥ 90 mph | $1,431 | 20% | 49¢ | 2.04x | 2,920 | $1,431 | yes | $2,920 |
| ≥ 100 mph | $1,145 | 16% | 37¢ | 2.70x | 3,095 | $1,145 | yes | $3,095 |
| ≥ 110 mph | $859 | 12% | 27¢ | 3.70x | 3,181 | $859 | yes | $3,181 |
| ≥ 120 mph | $716 | 10% | 20¢ | 5.00x | 3,580 | $716 | yes | $3,580 |
| ≥ 130 mph | $573 | 8% | 13¢ | 7.69x | 4,408 | $573 | yes | $4,408 |
| ≥ 140 mph | $429 | 6% | 8¢ | 12.50x | 5,363 | $429 | no | $0 |
| ≥ 150 mph | $286 | 4% | 5¢ | 20.00x | 5,720 | $286 | no | $0 |
| Total | $7,157 | 100% | 31,083 | $7,157 | $20,000 |
Table 1a: The Sarasota ladder at Reask’s forecasted exceedance probabilities on September 26, 06:00 UTC, rounded to the nearest cent. The six rungs from 80 through 130 mph are sized to return $20,000 together, the full deductible. She needs 100 mph to break even, which the model gave a 37% chance; priced this way, what she expects to get back equals what she puts in, so the position is fair. She loses money about two times in three, and the third time pays enough to make up for it. Powered by Reask.
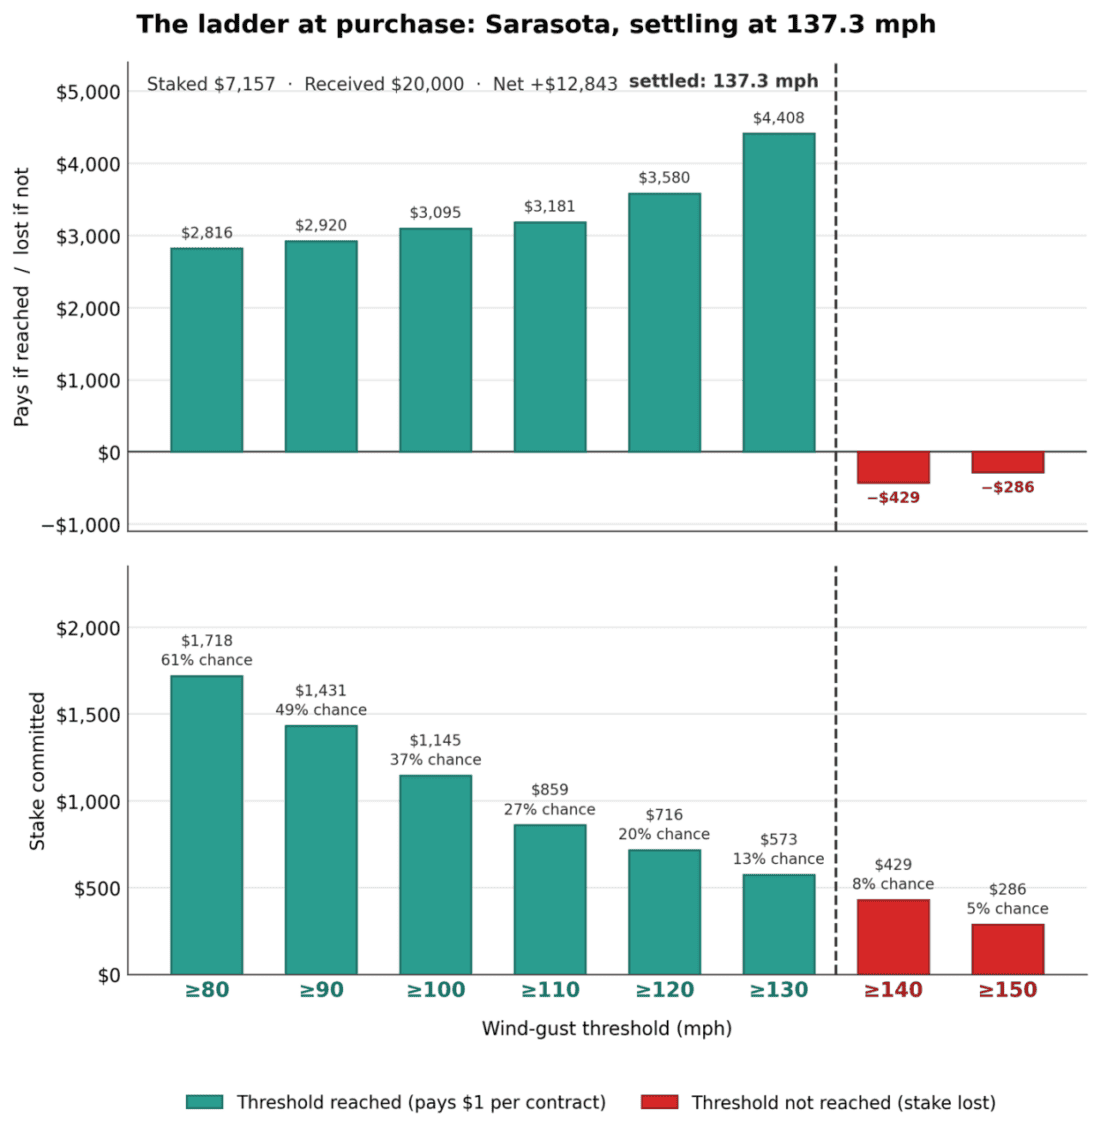
Figure 2: What each rung alone pays if its threshold is reached (top) and the dollar stake placed on each threshold (bottom). Teal marks the six rungs the storm cleared; red marks the two it didn’t, shown as the stake lost. In total, $7,157 went into the ladder and 31,083 contracts came out; the six teal rungs add to exactly $20,000. Powered by Reask. Made by Josh Hemmerling in Python.
For the sake of argument, let’s also consider a second homeowner in Tampa with the same house, the same $20,000 deductible, and the same $7,157 spread the same way.
Her prices are different because the Reask forecast gave Tampa lower odds at every rung of the wind gust exceedance ladder. Her 80-mph contract cost 55¢ against Sarasota’s 61¢; her 150-mph contract cost 3¢ against 5¢. Cheaper contracts mean she buys more of them with the same dollars. The same $7,157 bought her 44,705 contracts against Sarasota’s 31,083, and had Tampa taken the 137 mph that Sarasota did, her ladder would have paid $26,592 instead of $20,000. Cheaper isn’t some automatic bargain here; it’s the fair price regardless, and the expected outcome is a net of $0.
Table 1b. Tampa, same $7,157 ladder, Tampa prices, settled 97.6 mph
| Threshold | Stake | Share | Price | Payout multiple | Contracts | Cost | Paid? | Received |
|---|---|---|---|---|---|---|---|---|
| ≥ 80 mph | $1,718 | 24% | 55¢ | 1.82x | 3,124 | $1,718 | yes | $3,124 |
| ≥ 90 mph | $1,431 | 20% | 42¢ | 2.38x | 3,407 | $1,431 | yes | $3,407 |
| ≥ 100 mph | $1,145 | 16% | 31¢ | 3.23x | 3,694 | $1,145 | no | $0 |
| ≥ 110 mph | $859 | 12% | 21¢ | 4.76x | 4,090 | $859 | no | $0 |
| ≥ 120 mph | $716 | 10% | 14¢ | 7.14x | 5,114 | $716 | no | $0 |
| ≥ 130 mph | $573 | 8% | 8¢ | 12.50x | 7,163 | $573 | no | $0 |
| ≥ 140 mph | $429 | 6% | 5¢ | 20.00x | 8,580 | $429 | no | $0 |
| ≥ 150 mph | $286 | 4% | 3¢ | 33.33x | 9,533 | $286 | no | $0 |
| Total | $7,157 | 100% | 44,705 | $7,157 | $6,531 |
Table 1b: The Tampa ladder at the same moment, with the same dollars on every rung. Tampa also needs 100 mph to break even, and the model gave that a 31% chance. The storm came in 2.4 mph short of it. Powered by Reask.
Hurricane Ian rapidly intensified (as forecast) after Monday, September 26th, 2022, and made landfall as a Category 5 storm on Wednesday, September 28th, 2022, south of Tampa and Sarasota.
Gusts at Sarasota reached 137.3 mph, so six of the Sarasota homeowners’ eight rungs paid out. She got back $20,000 on the $7,157 she put in, a gain of $12,843.
She still owes the $20,000 to her insurer, but the extra $12,843 makes it less painful.
Tampa settled at 97.6 mph, so only two of the same rung set paid out. The Tampa homeowner thus got back only $6,531, or a $626 loss on the hedge, and her deductible was still due in full.

Figure 3: What each homeowner pays out of her own pocket under three positions, in the two cities the storm treated very differently. Bars assume a $50,000 roof replacement and a $20,000 deductible in both cities, with $7,157 spent on the hedge either way; hedged bars are net of what the hedge paid back. The Sarasota hedge returned the full deductible, so her out-of-pocket is the cost of the hedge itself, $7,157. Tampa’s returned $6,531 on $7,157, so she pays the deductible plus $626. Without a policy at all, the roof is a $50,000 bill outright in either city. Powered by Reask. Made by Josh Hemmerling in Python.
The Sarasota example is clearly the more favorable use case for these Live Hurricane Forecast Contracts, while the Tampa example was deliberately created to show a less favorable outcome where the homeowner ends up paying the full deductible while also netting a loss on her Forecast Contract hedge.
For example, we have assumed that the Tampa homeowner also sustained more than $20,000 in roof damage at 97.6 mph, which is possible but not necessarily likely. Despite the less-than-generous assumption, that homeowner ends up owing $20,626 instead of $20,000 had she not engaged with Forecast Contracts, which is not a tremendous difference. This partially reflects the idea that a hedge you buy but don’t end up needing still costs money, the same way an insurance premium applies in a year with no claim.
We also extend this analysis to the eight Florida cities in the Live Hurricane contract set most threatened by Ian on Monday, September 26th, 2022. Below is the identical $7,157 ladder bought at 06:00 UTC on that date at each city’s own prices, held to settlement.
Table 2. Same $7,157 ladder, eight cities, one storm
| City | 80 | 90 | 100 | 110 | 120 | 130 | 140 | 150 | Settled | Received | Net |
|---|---|---|---|---|---|---|---|---|---|---|---|
| Tarpon Springs | 56¢ | 45¢ | 31¢ | 22¢ | 14¢ | 8¢ | 4¢ | 2¢ | 89.2 | $3,068 | −$4,089 |
| Clearwater | 59¢ | 47¢ | 36¢ | 25¢ | 17¢ | 10¢ | 6¢ | 3¢ | 92.6 | $5,957 | −$1,200 |
| Tampa | 55¢ | 42¢ | 31¢ | 21¢ | 14¢ | 8¢ | 5¢ | 3¢ | 97.6 | $6,531 | −$626 |
| St. Petersburg | 59¢ | 48¢ | 36¢ | 26¢ | 17¢ | 10¢ | 6¢ | 4¢ | 101.9 | $9,074 | +$1,917 |
| Sarasota | 61¢ | 49¢ | 37¢ | 27¢ | 20¢ | 13¢ | 8¢ | 5¢ | 137.3 | $20,000 | +$12,843 |
| Naples | 36¢ | 22¢ | 14¢ | 9¢ | 6¢ | 4¢ | 3¢ | 1¢ | 142.9 | $69,558 | +$62,401 |
| Fort Myers | 42¢ | 28¢ | 20¢ | 12¢ | 9¢ | 4¢ | 3¢ | 2¢ | 156.6 | $72,965 | +$65,808 |
| Punta Gorda | 51¢ | 36¢ | 25¢ | 18¢ | 12¢ | 7¢ | 4¢ | 3¢ | 163.7 | $51,107 | +$43,950 |
Table 2: Prices are LiveCyc’s exceedance probabilities on September 26, 06:00 UTC, rounded to whole cents, with the same $7,157 on the same rungs in every city. The three southern results depend on filling thousands of contracts at a penny or two. If we disallow yes purchases below five cents (a rough stand-in for the difficulty of finding the other side at such low yes prices), the net payouts fall to roughly +$53,800 for Naples, +$48,600 for Fort Myers, and +$38,000 for Punta Gorda. Powered by Reask.
Every city got the exact same dollars on every rung: $1,718 on 80 mph down to $286 on 150. Sarasota was the model’s most exposed city, so its contracts cost the most and the fixed sum bought the fewest of them. Naples and Fort Myers were cheap because the forecast didn’t favor strong wind gusts there, so the same dollars bought far more contracts, and when the storm veered that way, the payout was far larger. That makes the key dynamic clear: the cheaper the contract, the bigger the payoff if it hits, but also the less likely it is to pay out.
The same strategy applied across eight cities produced net gains in five and net losses in three. Ian was a historic hurricane, and the Tarpon Springs ladder still lost more than half the money put in; its gusts came in at 89.2 mph, eight tenths of a mile per hour short of the 90-mph rung.
Which city could have done best? Perhaps, surprisingly, it wouldn’t have been the one with the strongest wind. Punta Gorda took 163.7 mph, the highest gust in the group, and returned $51,107. Fort Myers took less wind, 156.6 mph, and returned $72,965, about ten times the money put up and the best result for a hypothetical hedger on the coast. The biggest difference was how the contracts were priced two and a half days out. Punta Gorda was priced as a real possibility while Fort Myers’ top rung was still only a 2¢ contract, and it ended up resolving yes. The payout follows the gap between what was expected and what arrived, and Fort Myers was the biggest surprise on the coast. Naples was cheaper still and settled at 142.9 mph, seven short of a 150-rung priced at a penny.
However, in a realistic scenario, filling contracts priced at a penny or two is not something likely to be facilitated at size because the position is too unattractive to the counterparty.
Overall, this exercise illustrates that a ladder of wind gust contracts can be used as a hedge against a deductible gap in an insurance policy. Priced at the forecasted probability, the position is fair (expected outcome is net $0 not accounting for fees), so taking the position changes the distribution of outcomes and, in particular, can mitigate against the worst outcomes. The Sarasota homeowner received a payout equivalent to her full deductible, and the Tampa homeowner lost $626 with the same strategy. Across the eight cities, results ranged from a loss of $4,089 to a gain of $65,808, with the largest returns going to the cities the forecast least expected rather than to those that saw the strongest wind.
Every price in this piece is a probability generated by Reask’s LiveCyc hurricane forecast model, run retrospectively on Hurricane Ian from 2022. We don’t include a bid-offer spread or an exchange fee. In actual markets, we imagine a risk premium would emerge naturally, with YES prices bid up above their actuarial value and NO prices bid down below their actuarial value.
It should also be noted that much of Ian’s damage around Sarasota came from storm surge and flooding, which these contracts relate to but only indirectly.
Finally, wind speeds for these contracts are computed over land grid points within a 10 km radius of each city center and are thus not an exact measurement for any particular home.
New to Prediction Markets?
Open a Prediction Markets AccountThe analysis in this material is provided for information only and is not and should not be construed as an offer to sell or the solicitation of an offer to buy any security. To the extent that this material discusses general market activity, industry or sector trends or other broad-based economic or political conditions, it should not be construed as research or investment advice. To the extent that it includes references to specific securities, commodities, currencies, or other instruments, those references do not constitute a recommendation by IBKR to buy, sell or hold such investments. This material does not and is not intended to take into account the particular financial conditions, investment objectives or requirements of individual customers. Before acting on this material, you should consider whether it is suitable for your particular circumstances and, as necessary, seek professional advice.
The views and opinions expressed herein are those of the author and do not necessarily reflect the views of Interactive Brokers, its affiliates, or its employees.
Futures, event contracts, and forecast contracts are not suitable for all investors. Before trading these products, please read the CFTC Risk Disclosure. For a copy, visit our Warnings and Disclosures Page.
Event Contracts are only available to eligible clients, 21 years and older, of Interactive Brokers LLC, Interactive Brokers Canada Inc., Interactive Brokers Hong Kong Limited, Interactive Brokers Ireland Limited and Interactive Brokers Singapore Pte. Ltd. ForecastEx Forecast Contracts on US election results are only available to eligible US residents.
Displayed outcomes and prices are based on real-time market sentiment from ForecastEx LLC, an affiliate of IB LLC, as well as other CFTC-registered DCMs, including Kalshi and CME. For more information, see ibkr.com/realfex Note: Real-time market sentiment updates are only active during exchange open trading hours. Updates to current market sentiment for overnight activity will be reflected at the open on the next trading day. This information is not intended by IBKR as an opinion or likelihood of a potential outcome.
This is commentary on economic, political and/or market conditions within the meaning of CFTC Regulation 1.71, and is not meant provide sufficient information upon which to base a decision to enter into a derivatives transaction.
Interactive Brokers LLC is a CFTC-registered Futures Commission Merchant and a clearing member and affiliate of ForecastEx LLC (“ForecastEx”). ForecastEx is a CFTC-registered Designated Contract Market and Derivatives Clearing Organization. Interactive Brokers LLC provides access to ForecastEx Forecast Contracts for eligible customers. Interactive Brokers LLC does not make recommendations with respect to any products available on its platform, including those offered by ForecastEx.
Related Articles

















Join The Conversation
For specific platform feedback and suggestions, please submit it directly to our team using these instructions.
If you have an account-specific question or concern, please reach out to Client Services.
We encourage you to look through our FAQs before posting. Your question may already be covered!