
- Solve real problems with our hands-on interface
- Progress from basic puts and calls to advanced strategies
Interactive Options Course

Posted March 30, 2026 at 11:15 am
Recent geopolitical tensions, particularly those involving the United States and Iran, have introduced a renewed wave of uncertainty into global financial markets. Despite this backdrop, a multi-layered analysis of the S&P 500 suggests that the current phase may represent a pivotal moment rather than the beginning of a prolonged downturn.
This article explores several analytical perspectives—fundamental valuation, positioning data, seasonality, sentiment, and pattern recognition—to better understand the current market environment. The observations presented reflect a personal interpretation of market data and should not be considered investment advice.
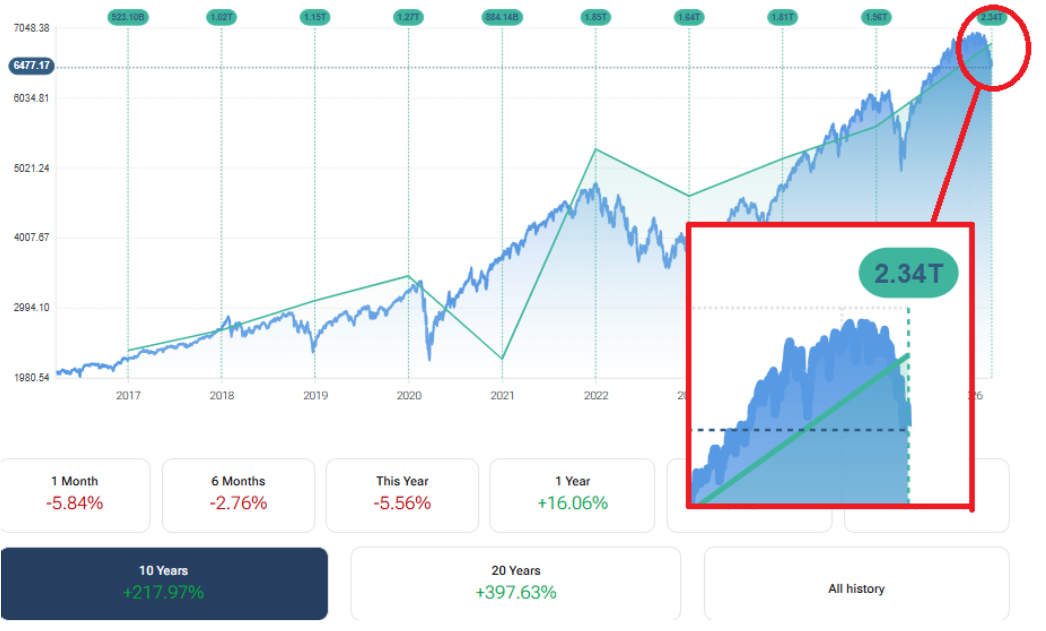
One of the most notable developments is the relationship between market prices and corporate earnings. Historically, the S&P 500 has shown a strong correlation between price levels and aggregate net income generated by its constituent companies.
At present, prices have moved below the net income trend line, while earnings continue to rise. This divergence suggests that, from a fundamental standpoint, the index may be becoming increasingly inexpensive relative to the underlying profitability of its components.
Source: Forecaster.biz Terminal
Price vs. Net Income: the S&P 500 is trading below its earnings trend, highlighting a rare divergence between market prices and corporate profitability. Source: Forecaster Terminal
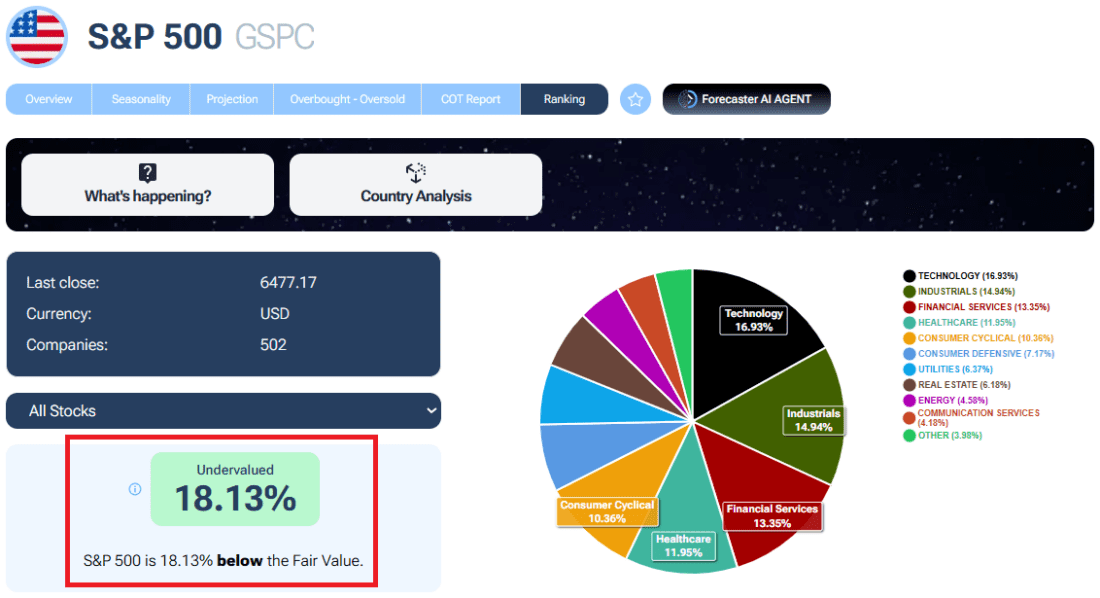
A broader valuation analysis reinforces this view. When aggregating fair value estimates across the index—based on multiple methodologies such as discounted cash flow and earnings-based models—the S&P 500 appears modestly undervalued. While not yet at historically extreme levels, the degree of undervaluation is approaching thresholds that have previously attracted long-term institutional interest.
Source: Forecaster.biz Terminal
The S&P 500 appears approximately 18% undervalued, based on Forecaster’s aggregate fair value model, which combines multiple valuation methods—including discounted cash flow, earnings-based models, and sales multiples—across all index constituents.
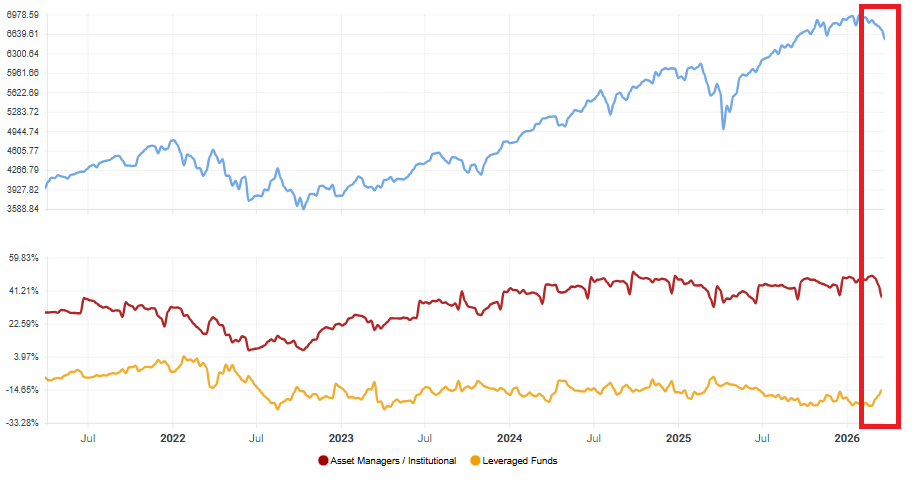
Another important layer of analysis comes from the Commitments of Traders report, which provides insight into how different market participants are positioned.
Recent data shows a decline in net long positions among asset managers, typically considered long-term investors. This behavior may reflect caution linked to geopolitical risks and macroeconomic uncertainty.
At the same time, leveraged funds—often more speculative in nature—have increased their net long exposure during the recent market decline. This divergence suggests a market environment where long-term players are temporarily reducing risk, while shorter-term participants are actively “buying the dip.”
Source: Forecaster.biz Terminal
The Commitments of Traders report shows a recent reduction in net long positions by asset managers, while leveraged funds have increased exposure—highlighting a divergence between long-term caution and short-term dip buying. Source: Forecaster Terminal Cot Report for S&P 500
Such contrasting behavior does not provide a definitive directional signal but highlights the complexity of current market sentiment.
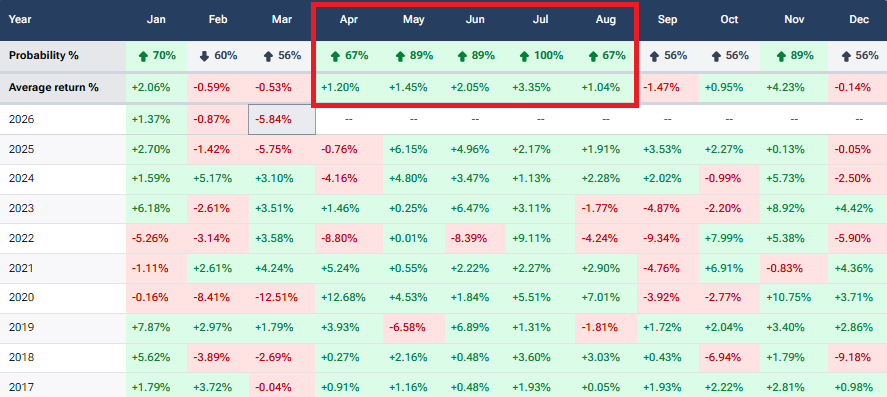
Seasonality analysis offers another perspective by examining how markets have behaved during similar periods in the past. (here below the S&P 500 seasonality table from forecaster Terminal)
Source: Forecaster.biz Terminal
Historically, the current time window has often coincided with the beginning of stronger equity performance phases. This does not guarantee future outcomes but suggests that, from a statistical standpoint, the market may be entering a period that has previously favored upward momentum.
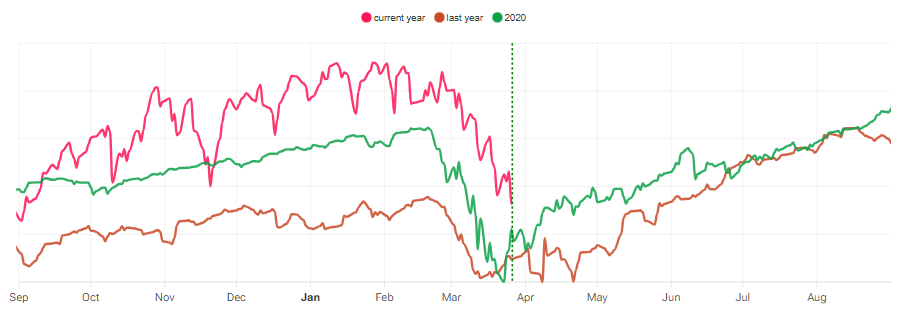
A deeper comparison reveals strong similarities between current price action and past market environments, particularly 2020 and the previous year. These analogues present different potential scenarios: one implying a near-term rebound, the other allowing for additional downside before recovery. However, in both cases, the historical patterns suggest that the market may be approaching a meaningful inflection point. Whether prices follow the sharper rebound observed in 2020 or the more gradual bottoming process seen last year, the current positioning appears consistent with phases that have previously preceded a change in trend.
Source: Forecaster.biz Terminal
Historical analogues show that both 2020 and last year’s price action point toward a potential inflection phase, suggesting the market may be nearing a turning point regardless of the short-term path. Source: Forecaster Terminal S&P 500 Correlation.
From a sentiment perspective, indicators designed to measure overbought and oversold conditions currently point to a phase of heightened market stress.
The market appears to be in what could be described as a “panic selling” zone. Historically, such conditions have often coincided with periods where risk premiums increase and potential opportunities emerge, although timing remains inherently uncertain.

Source: Forecaster.biz Terminal
Sentiment indicators point to oversold conditions in the S&P 500, with signals consistent with heightened market stress and potential stabilization phases.
Additionally, the presence of bullish divergence—where price action weakens while underlying indicators stabilize—has been relatively rare over the past decade. While not predictive on its own, this signal has historically appeared near important inflection points.
Pattern recognition techniques provide yet another analytical lens by identifying similarities between current price behavior and historical market patterns.
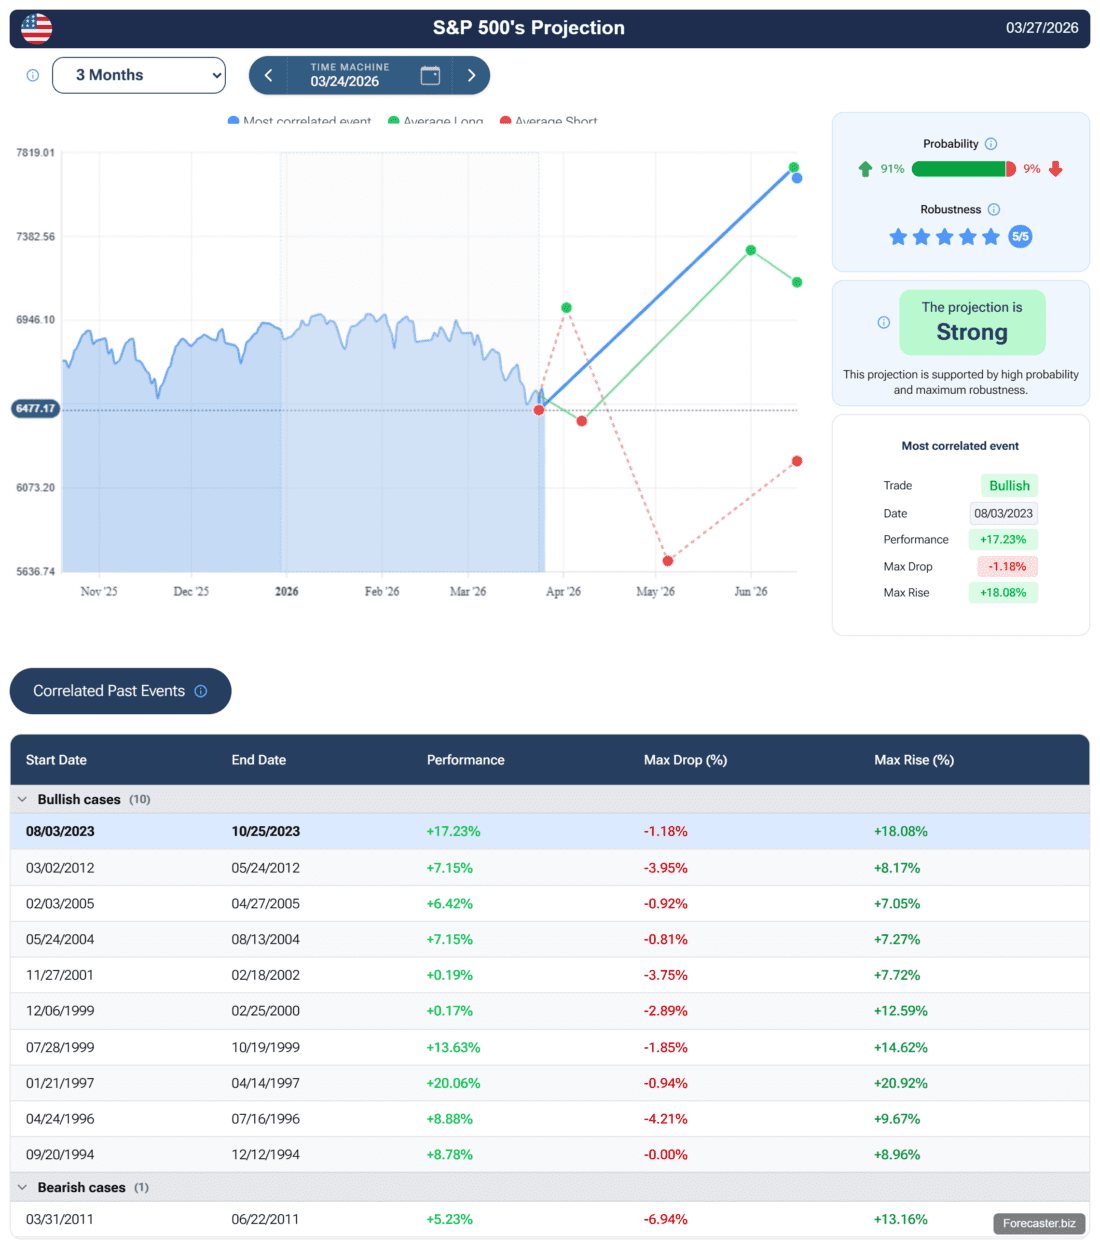
When analyzing recent market movements over a three-month horizon, similar patterns have occurred multiple times in the past. In most of these cases (91% of cases), the subsequent market behavior was positive, suggesting a tendency toward recovery following similar setups.
Source: Forecaster.biz Terminal
The image highlights previous moments when the S&P 500 behaved like it is today—and shows that, in most of those cases, the market moved higher afterward. Source: Forecaster Terminal Pattern Recognition tool.
However, it is important to emphasize that historical patterns do not guarantee future results. They serve as probabilistic tools rather than deterministic forecasts.
When combining these different perspectives—fundamental valuation, institutional positioning, seasonality, sentiment, and pattern recognition—a consistent theme emerges: the market may be closer to a significant inflection point than headline narratives might suggest.
This does not eliminate the possibility of further downside. In fact, additional declines could deepen the valuation discount and potentially strengthen the long-term case for equities. Rather, it highlights how periods of uncertainty often coincide with evolving opportunity sets.
—
Originally Posted on March 27, 2026
For specific platform feedback and suggestions, please submit it directly to our team using these instructions.
If you have an account-specific question or concern, please reach out to Client Services.
We encourage you to look through our FAQs before posting. Your question may already be covered!
Information posted on IBKR Campus that is provided by third-parties does NOT constitute a recommendation that you should contract for the services of that third party. Third-party participants who contribute to IBKR Campus are independent of Interactive Brokers and Interactive Brokers does not make any representations or warranties concerning the services offered, their past or future performance, or the accuracy of the information provided by the third party. Past performance is no guarantee of future results.
This material is from Forecaster.biz and is being posted with its permission. The views expressed in this material are solely those of the author and/or Forecaster.biz and Interactive Brokers is not endorsing or recommending any investment or trading discussed in the material. This material is not and should not be construed as an offer to buy or sell any security. It should not be construed as research or investment advice or a recommendation to buy, sell or hold any security or commodity. This material does not and is not intended to take into account the particular financial conditions, investment objectives or requirements of individual customers. Before acting on this material, you should consider whether it is suitable for your particular circumstances and, as necessary, seek professional advice.
Related Articles

 for Daily Seasonal Data")


Great analysis.
Very good thanks