
- Solve real problems with our hands-on interface
- Progress from basic puts and calls to advanced strategies
Interactive Options Course

Posted September 22, 2025 at 11:15 am
Seasonality is a statistical observation, not a predictive tool. It highlights recurring patterns in historical price data, showing how an asset has tended to behave during specific times of the year. While useful for context, seasonality does not forecast future performance and should always be combined with broader analysis and risk management.
As of late September 2025, Bitcoin (BTCUSD) is showing remarkable alignment with its historical seasonality patterns. According to the Forecaster Terminal, which aggregates average performance over the last 3, 5, and 7 years, Bitcoin has historically exhibited a strong bullish bias starting in early October and accelerating toward year-end.
This strong correlation with the 3-year average suggests that the current price action is not an anomaly but rather part of a repeating seasonal trend. In previous years, a mid-year consolidation has often been followed by an October-December rally, as is now potentially underway.
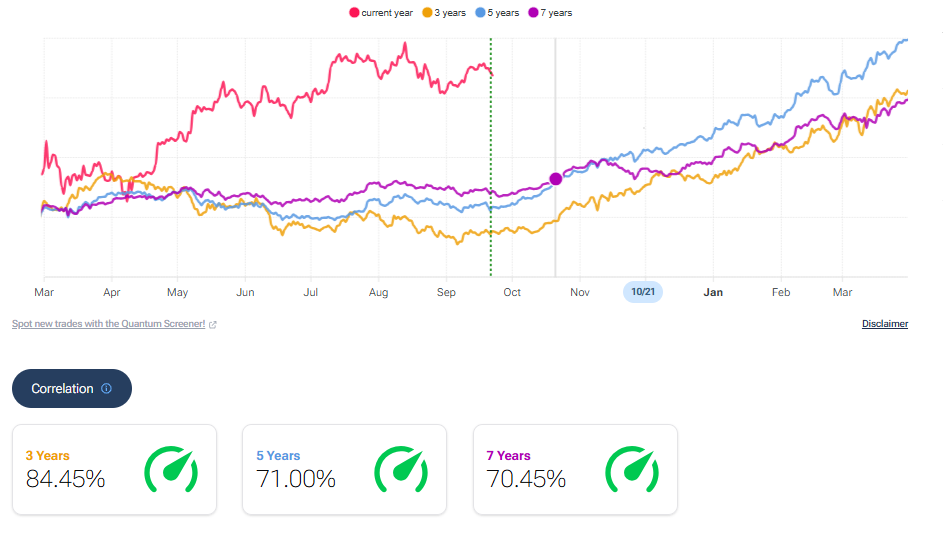
Bitcoin’s 2025 price shows a strong correlation with historical trends — especially the 3-year average, which aligns with an 84.45% match. Historically, October has marked the beginning of a sustained upward move, reinforcing the seasonal bullish bias.. Source: Forecaster.biz
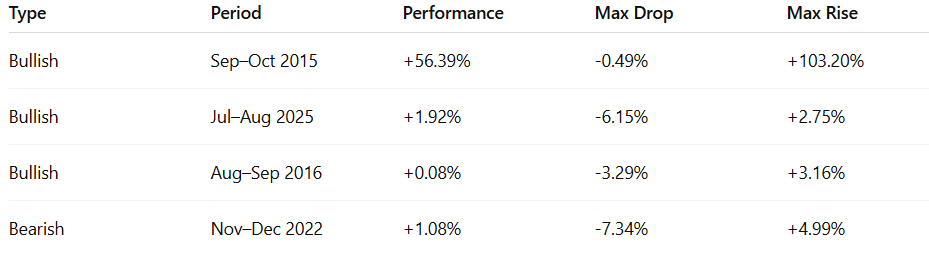
The most statistically correlated historical event identified by the Forecaster Terminal’s projection model is from August 8, 2016, a period where Bitcoin experienced a relatively neutral but structurally important consolidation phase. Despite the limited overall performance during that month (+0.08%), this past case mirrors the current setup in terms of price structure, volatility compression, and technical posture.
In the 2016 case, Bitcoin faced a brief intra-period pullback of -3.29%, followed by a recovery toward a maximum upside of +3.16%, staying within a relatively tight range. This historical episode is significant because it occurred after a multi-month rally and just before Bitcoin began a longer-term ascent in Q4 of that year.
The AI-powered projection engine interprets this analogue not only for its raw returns, but also for its behavioral pattern: a sideways-to-upward drift with controlled downside, which is similar to current market conditions. While this does not guarantee that 2025 will follow the same trajectory, it strengthens the thesis for a moderate upside scenario with limited risk, particularly in the absence of major macro shocks.
Note: While the 2016 pattern is classified as “bullish,” the actual return was marginal, reinforcing the idea that “bullish” in this context refers to structure and directionality more than to magnitude. Traders should interpret it as a moderately constructive scenario, not a high-conviction breakout.
The base case scenario points to a limited but positive upside, with price targets around +2–3% over the next 2–3 weeks. The model suggests a possible brief drawdown in the short term before a recovery, which mirrors past behavior in similar conditions.
The AI system has identified three bullish analogues and one bearish case in its database. The most notable comparison is from September 2015, which saw a +56.39% performance over just four weeks. However, this remains an outlier.
While historical matches offer a statistical frame of reference, they are not investment advice and should not be interpreted as deterministic outcomes.
Both the seasonal model and the short-term AI projection from Forecaster suggest that Bitcoin may enter a favorable period as we approach Q4 2025. However, traders and investors should remember:
For traders using Interactive Brokers platforms, this data can complement your technical and fundamental research, helping frame expectations based on recurring market behavior.
Disclaimer: This article is for informational purposes only and does not constitute investment advice. The analysis is based on historical data and statistical correlations provided by third-party software. Investors should conduct their own research or consult a financial advisor before making trading decisions. Interactive Brokers assumes no responsibility for the accuracy or completeness of third-party tools or content.
—
Originally Posted on September 22, 2025
Information posted on IBKR Campus that is provided by third-parties does NOT constitute a recommendation that you should contract for the services of that third party. Third-party participants who contribute to IBKR Campus are independent of Interactive Brokers and Interactive Brokers does not make any representations or warranties concerning the services offered, their past or future performance, or the accuracy of the information provided by the third party. Past performance is no guarantee of future results.
This material is from Forecaster.biz and is being posted with its permission. The views expressed in this material are solely those of the author and/or Forecaster.biz and Interactive Brokers is not endorsing or recommending any investment or trading discussed in the material. This material is not and should not be construed as an offer to buy or sell any security. It should not be construed as research or investment advice or a recommendation to buy, sell or hold any security or commodity. This material does not and is not intended to take into account the particular financial conditions, investment objectives or requirements of individual customers. Before acting on this material, you should consider whether it is suitable for your particular circumstances and, as necessary, seek professional advice.
Trading in digital assets, including cryptocurrencies, is especially risky and is only for individuals with a high risk tolerance and the financial ability to sustain losses. Eligibility to trade in digital asset products may vary based on jurisdiction.
IB is not party to any transactions in digital assets and does not custody digital assets on your behalf. Paxos Trust Company ("Paxos") is your counterparty to any transactions in digital assets, and any positions in digital assets are custodied solely with Paxos and held in an account in your name outside of IB. Digital assets held with Paxos are not protected by SIPC. Digital asset trading with Paxos is limited to U.S. residents with individual or joint accounts.
TRADING IN BITCOIN FUTURES IS ESPECIALLY RISKY AND IS ONLY FOR CLIENTS WITH A HIGH RISK TOLERANCE AND THE FINANCIAL ABILITY TO SUSTAIN LOSSES. More information about the risk of trading Bitcoin products can be found on the IBKR website. If you're new to bitcoin, or futures in general, see Introduction to Bitcoin Futures.
Related Articles


")


Join The Conversation
For specific platform feedback and suggestions, please submit it directly to our team using these instructions.
If you have an account-specific question or concern, please reach out to Client Services.
We encourage you to look through our FAQs before posting. Your question may already be covered!