
- Solve real problems with our hands-on interface
- Progress from basic puts and calls to advanced strategies
Interactive Options Course

Posted December 13, 2024 at 12:00 pm
Thanks to an out-of-the-office business appointment, today’s piece will be a bit more brief than usual. Some things that have caught my attention this morning include investor’s understandable love for optimistic corporate guidance, their disdain for GAAP earnings, another yield curve disinversion, and continued bad breadth. For brevity’s sake, we will present them in the form of an outline rather than the usual paragraph format.
Guidance!
Broadcom (AVGO) had a modest beat on current earnings, but it’s the optimistic guidance that got the stock zooming. The opposite was the case with Oracle (ORCL) and Adobe (ADBE) earlier this week. It’s quite clear that an EPS beat in the current quarter is a necessary, but not a sufficient condition for a rally.
Remember that one of the pillars of the market’s valuation is that there is a general expectation for S&P 500 (SPX) earnings to be up about 15%. Considering that real GDP is expected to be about 3% and inflation is running about 3%, that implies that big companies can grow earnings by an incremental 9%. That’s doable, but it implies that a lot of profit optimism is already baked into stock prices. Any shortfall is being punished, often harshly.
Do GAAP[i] earnings matter? Apparently not. On a GAAP basis, AVGO earned $0.94 but reported $1.42 on a pro-forma basis. This spread is typical for AVGO, along with a wide range of tech and other companies. Remember that pro-forma earnings exclude certain costs that a company believes distort its true profitability,
Pro-forma all but assures that a company can beat its number. It’s nice to be able to selectively exclude expenses.
Hence the focus on revenues, cash flows and guidance. Those are unadulterated.
Once again there are far more SPX decliners vs. advancers (367-130 as I type this). On the NYSE it’s 2.5:1 for the decliners. The rally is narrowing, not broadening.
The 3mo/10yr yield curve finally disinverted. Most of us have been focused on the 2-10 relationship, but one can argue that the 3mo-10y is more important because it more directly affects a bank’s cost of funding. Either way, the following chart shows that while inverted yield curves are a considered a harbinger of recessions, the recessions only begin AFTER the curve normalizes:
(in chart below, white histogram is 2-10, blue line is 3m-10, red is when NBER declared the start of a recession and green is when they say it ended)
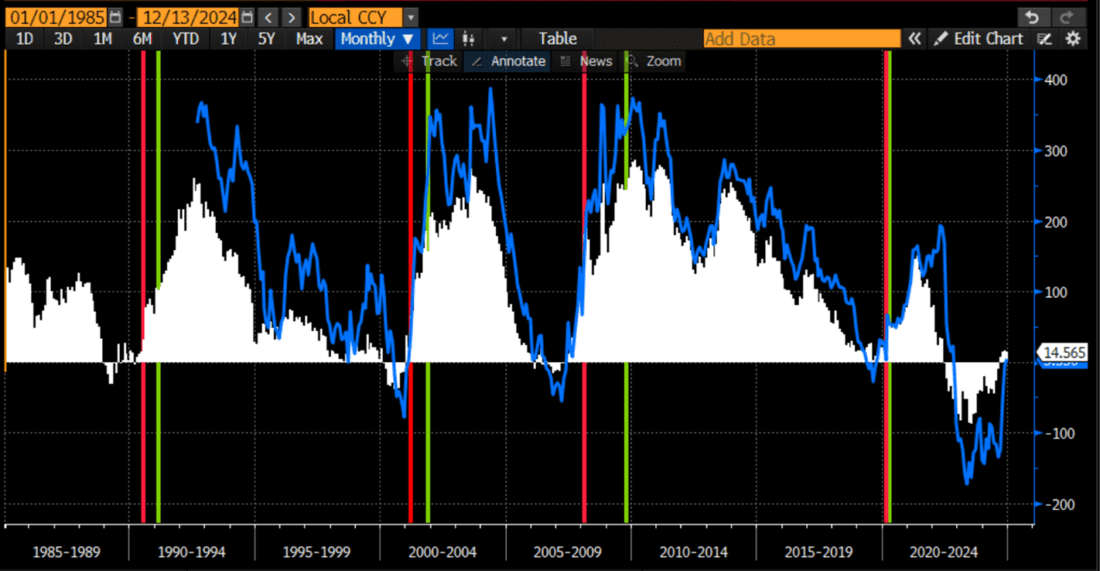
Source: Bloomberg, Interactive Brokers
—
[i] GAAP: Generally Accepted Accounting Principles
For specific platform feedback and suggestions, please submit it directly to our team using these instructions.
If you have an account-specific question or concern, please reach out to Client Services.
We encourage you to look through our FAQs before posting. Your question may already be covered!
The analysis in this material is provided for information only and is not and should not be construed as an offer to sell or the solicitation of an offer to buy any security. To the extent that this material discusses general market activity, industry or sector trends or other broad-based economic or political conditions, it should not be construed as research or investment advice. To the extent that it includes references to specific securities, commodities, currencies, or other instruments, those references do not constitute a recommendation by IBKR to buy, sell or hold such investments. This material does not and is not intended to take into account the particular financial conditions, investment objectives or requirements of individual customers. Before acting on this material, you should consider whether it is suitable for your particular circumstances and, as necessary, seek professional advice.
The views and opinions expressed herein are those of the author and do not necessarily reflect the views of Interactive Brokers, its affiliates, or its employees.


Really strange to use the word ‘modest’ in any discussion of BROADCOM’S announcement yesterday? Yes, I know it was used in reference to its earnings, but those earnings beat. Left out was the fact that growth ACCELERRATED for the second quarter in a row and revenues TRIPLED for the year! Enough with the graph comparisons and options sightings both are related to witchcraft and the tossing of sticks.
Market sniffing out the fact that Trump’s policies will drive our economy down the toilet?
Take heart, pharmaceutical companies are working on a vaccine for TDS. Should be available soon.
Sorry you are missing the 2nd trump bump. Hope you made enough from the 1st one
Keep reading about mass deportation of workers. Don’t you need a SS# to get a job? Are writers including selling bags of oranges on the corner to payback the cartel as employees?
Very interesting, to say the least. It would have been great if the chart showed enough resolution to read the value at which the recession starts.
Thank you for reaching out. We have reviewed the graph and find the resolution to be satisfactory.
Thanks sir for this analysis. Recession is indeed coming IMHO. 96% of trader think the FED will cut rates. I am part of the 4% who think they may won’t. At least, they should not base on the recent numbers. TLT is down a lot. If they do in December, they will not cut in 2025. Inflation is back. PPI went up. Core went up. There is no way they can achieve 2% in 2025 by cutting rates.
this is a great observation regarding the over regard for p/e’s recently printed from Yahoo Ginance: “The big takeaway is that there is effectively no linear relationship between forward P/Es and one-year returns. In other words, the P/E ratio is a very poor market-timing tool.” “[T]he correlation between the S&P 500’s forward P/E and subsequent one-year performance — going back to the 1950s — is -0.11, which means there is virtually no relationship,” Sonders and Gordon observed. “Perhaps less important is the correlation and yellow line; more important is the range of outcomes, such as two opposite instances in which the forward P/E was 25, but in one case was followed by a ~30% decline the following year and in another case a ~45% increase in the following year.”