
- Solve real problems with our hands-on interface
- Progress from basic puts and calls to advanced strategies
Interactive Options Course
Posted April 25, 2025 at 10:45 am
Within days of President Trump’s April 2 announcement of global tariffs – which shocked financial markets globally for their scale and size – the S&P 500® Index had lost just over 12% of its value. Even more quickly, after the president authorized a 90-day pause on said tariffs (excluding China), the benchmark staged one of its most impressive one-day rallies ever.
Drawdowns are more frequent than not
The continued volatility has left many investors asking, “This isn’t normal, right?”
The answer to that question is more nuanced than might first appear. In the last 25 years or so, the S&P 500 has experienced more than a half dozen bear markets (a decline of 20% or more from recent highs), with price declines of 5% or more occurring in most calendar years – including those when the benchmark finished with positive returns.
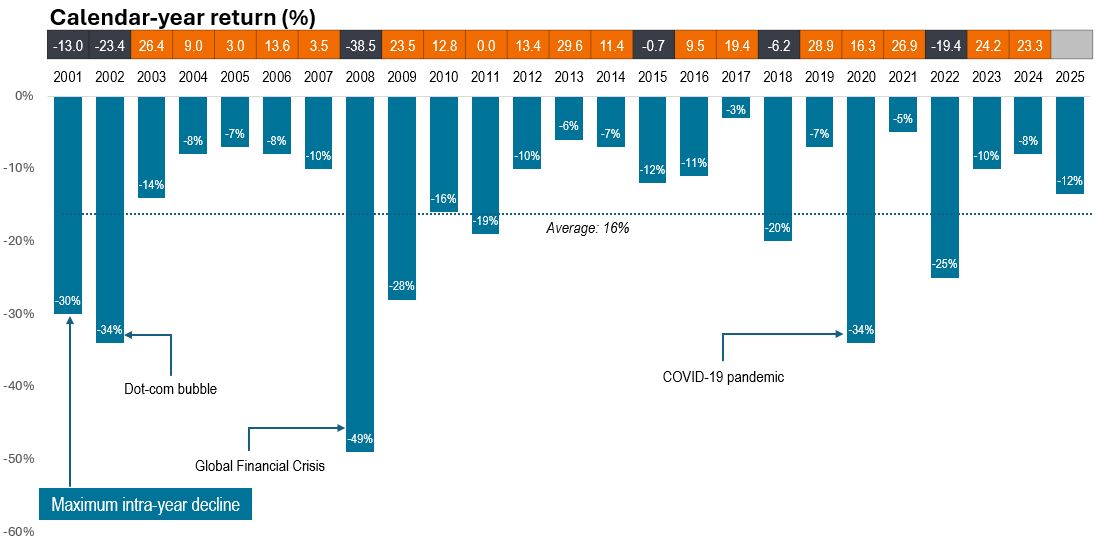
Source: FactSet, S&P U.S. Data from 31 December 2000 to 8 April 2025. Returns reflect price change. Past performance is no guarantee of future results.
What was unusual this time around was the speed of the sell-off. The S&P 500 dropped -4.8% on April 3, followed by a fall of -6.0% the following day. That marked only the 13th time since 1929 that the benchmark experienced back-to-back trading days with declines of -4.5% or more.
Such large market moves in such a compressed period can make it tempting for investors to run for safety. But history suggests that impulse might not be the correct one. Volatility begets volatility, with a rise in short-term and algorithmic trading activity helping intensify intraday price swings. But stocks have often gone on to stage significant moves to the upside following these drawdowns.
Case in point, only days after the tariff-induced sell-off, the S&P 500 snapped back on April 9, rallying 9.5%. The one-day turnaround was not enough to retrace all the S&P’s losses, but it still ranks among the top 10 of one-day gains in the index’s history (Exhibit 2). Notably, the three consecutive sessions from April 7 to 9 were each among the 35 most volatile on record based on intraday highs and lows.1
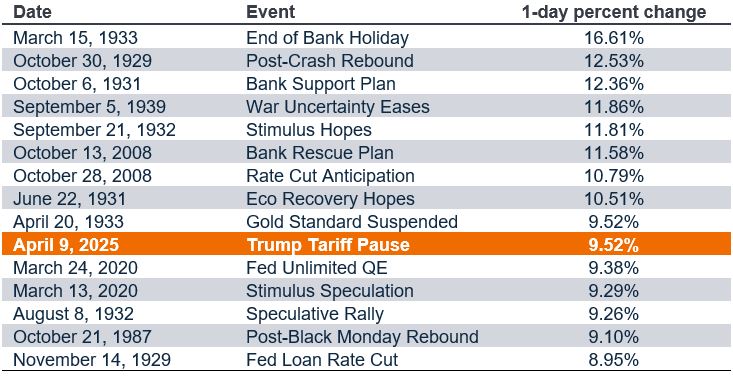
Source: Bloomberg, as at 10 April 2025. Past performance is no guarantee of future results.
Where to from here?
Much remains unknown about the next stages of the trade war, with the potential near- and long-term investment and economic implications likewise unclear. For now, investors are weighing the potential inflationary impact of tariffs and how consumers will react to higher prices. Continually shifting trade terms also raise questions about how long tariffs will last and at what level, and how companies will adapt to the new operating environment.
Given the uncertainty, it would be prudent to expect further volatility. And while market volatility is inherently unsettling, it’s important to note that it is not necessarily a harbinger of a downward trend. In fact, significant spikes in volatility – as measured by the VIX Index – have often signaled future gains (Exhibit 3).
| Date VIX crossed 40 | VIX closing price | S&P 500 return, next 12 months |
| August 31, 1998 | 44.28 | 39.79% |
| September 17, 2001 | 41.76 | -14.64% |
| July 22, 2002 | 41.87 | 22.71% |
| September 19, 2002 | 40.65 | 25.12% |
| September 29, 2008 | 46.72 | -1.55% |
| May 7, 2010 | 40.95 | 23.60% |
| Augusts 8, 2011 | 48.00 | 28.07% |
| September 22, 2011 | 41.35 | 32.17% |
| August 24, 2015 | 40.74 | 18.07% |
| February 28, 2020 | 40.11 | 34.39% |
| June 11, 2020 | 40.79 | 43.71% |
| October 28, 2020 | 40.28 | 42.57% |
| April 4, 2025 | 45.31 | — |
Source: Bloomberg, as at 17 April 2025. VIX spikes based on latest price. Spikes above 40 noted if they occur more than one month after the previous spike. Past performance is no guarantee of future results.
The potential for short periods of volatility to lead to longer-term stretches of gains shows that it has often paid to ride out the inevitable fluctuations. Furthermore, the swiftness of recent moves makes it clear that trying to time the market can cause more damage to a portfolio than market volatility itself, as illustrated in Exhibit 4.
Value of a hypothetical $10,000 investment in the S&P 500 Index from 1999 – April 2025
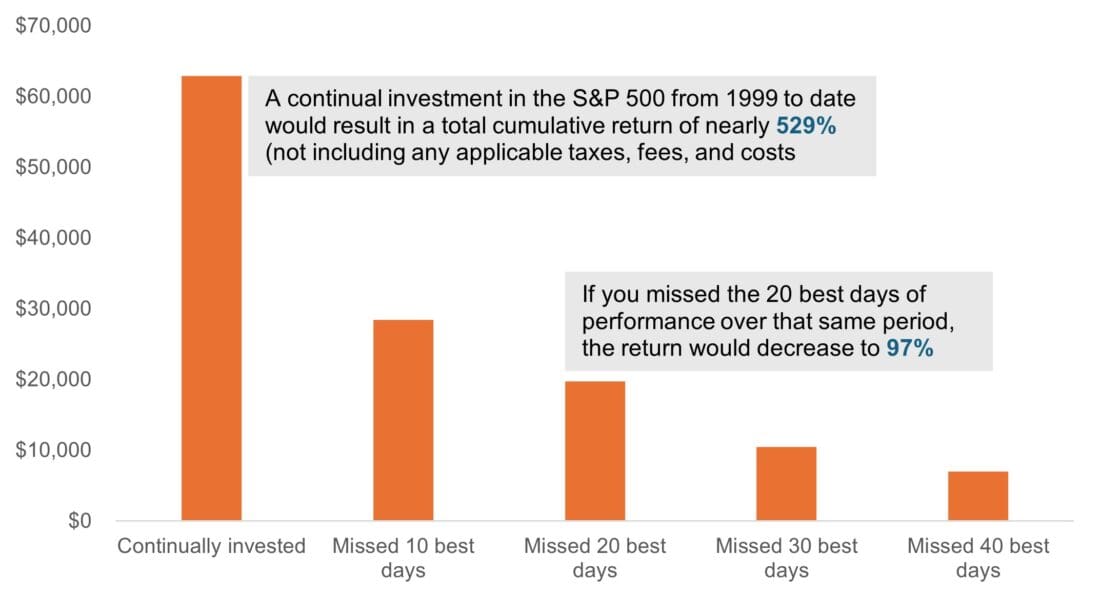
Source: Bloomberg, Janus Henderson Investors. As at 21 April 2025. Past performance is no guarantee of future results.
The value of active management in volatile markets
For investors with longer-term horizons, staying in the market has ultimately paid off. This is especially the case when volatility presents an opportunity to upgrade portfolios.
As active managers, in times of significant volatility, we seek to take advantage of attractive entry points on stocks where valuation may have previously prevented our investment. We also have the latitude to look at a wider spectrum of companies, beyond the indices, to find quality business models and companies we think have the potential to outperform over the long term.
We know that a new paradigm for global trade – regardless of its ultimate form – will present both opportunities and risks, and companies with proven management teams, quality business models, competitively advantaged products, and/or strong intellectual property should hold their own. We believe this is an era when companies with tenuous business models and backward-looking, reactive strategies may fracture – but when the strongest companies can still thrive.
—
Originally Posted April 22, 2025 – Taking the long view on tariff-driven volatility
The opinions and views expressed are as of the date published and are subject to change. They are for information purposes only and should not be used or construed as an offer to sell, a solicitation of an offer to buy, or a recommendation to buy, sell or hold any security, investment strategy or market sector. No forecasts can be guaranteed. Opinions and examples are meant as an illustration of broader themes, are not an indication of trading intent and may not reflect the views of others in the organization. It is not intended to indicate or imply that any illustration/example mentioned is now or was ever held in any portfolio. Janus Henderson Group plc through its subsidiaries may manage investment products with a financial interest in securities mentioned herein and any comments should not be construed as a reflection on the past or future profitability. There is no guarantee that the information supplied is accurate, complete, or timely, nor are there any warranties with regards to the results obtained from its use. Past performance is no guarantee of future results. Investing involves risk, including the possible loss of principal and fluctuation of value.
Janus Henderson Group plc ©
W-0425-1210452-04-30-2026
The opinions and views expressed are as of the date published and are subject to change without notice. They are for information purposes only and should not be used or construed as an offer to sell, a solicitation of an offer to buy, or a recommendation to buy, sell or hold any security, investment strategy or market sector. No forecasts can be guaranteed. Opinions and examples are meant as an illustration of broader themes and are not an indication of trading intent. It is not intended to indicate or imply that any illustration/example mentioned is now or was ever held in any portfolio. Janus Henderson Group plc through its subsidiaries may manage investment products with a financial interest in securities mentioned herein and any comments should not be construed as a reflection on the past or future profitability. There is no guarantee that the information supplied is accurate, complete, or timely, nor are there any warranties with regards to the results obtained from its use. Past performance is no guarantee of future results. Investing involves risk, including the possible loss of principal and fluctuation of value.
Information posted on IBKR Campus that is provided by third-parties does NOT constitute a recommendation that you should contract for the services of that third party. Third-party participants who contribute to IBKR Campus are independent of Interactive Brokers and Interactive Brokers does not make any representations or warranties concerning the services offered, their past or future performance, or the accuracy of the information provided by the third party. Past performance is no guarantee of future results.
This material is from Janus Henderson and is being posted with its permission. The views expressed in this material are solely those of the author and/or Janus Henderson and Interactive Brokers is not endorsing or recommending any investment or trading discussed in the material. This material is not and should not be construed as an offer to buy or sell any security. It should not be construed as research or investment advice or a recommendation to buy, sell or hold any security or commodity. This material does not and is not intended to take into account the particular financial conditions, investment objectives or requirements of individual customers. Before acting on this material, you should consider whether it is suitable for your particular circumstances and, as necessary, seek professional advice.
Related Articles


Join The Conversation
For specific platform feedback and suggestions, please submit it directly to our team using these instructions.
If you have an account-specific question or concern, please reach out to Client Services.
We encourage you to look through our FAQs before posting. Your question may already be covered!