
- Solve real problems with our hands-on interface
- Progress from basic puts and calls to advanced strategies
Interactive Options Course

Posted February 25, 2026 at 9:45 am
After years in the shadow of Big Tech, small-cap stocks are outperforming and the reasons suggest the trend may have staying power.
The Russell 2000’s four-month outperformance against mega-cap tech represents one of 2025’s most significant but underappreciated market rotations. In November, concerns around stretched valuations began to grow, and on November 20, E-mini Nasdaq-100 (NQ) options volume marked their third highest volume day as traders hedged and navigated tech uncertainty following Nvidia earnings and Non-Farm Payrolls (NFP) data.
.jpg)
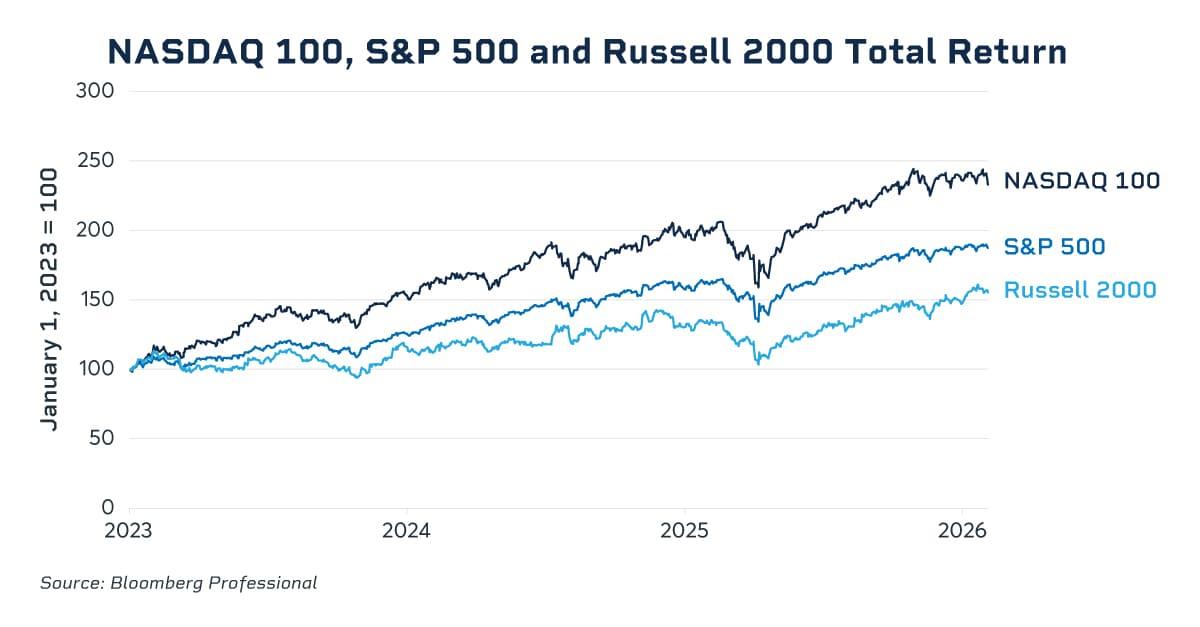
Since November 21, the small-cap Russell 2000 index has surged more than 16% and touched record highs on January 22. Over the same period, the Nasdaq climbed just 8%. The S&P 500 hasn’t kept pace either, despite reaching its own new highs in late January.
The shift marks a striking reversal from the previous three years, when artificial intelligence (AI) euphoria drove the Nasdaq up 145% while small caps languished. To fully understand the mechanics of this trade, let’s go back to the beginning.
In early 2023, the Nasdaq Composite began what would become a historic rally, surging 145% in less than three years. The advance was remarkable not just for its magnitude, but for its narrow leadership. A small group of mega-cap technology companies, particularly those at the forefront of the AI evolution, drove the bulk of the gains.
To illustrate the magnitude of this move: When the Nasdaq reached its all-time high in November 2023, the S&P 500 trailed far behind with a gain of 79%, and the Russell 2000 lagged even further behind with a modest 43% gain. The tailwind for the Nasdaq was widely reported and dominated financial media headlines, while Russell’s underperformance received less attention.
Most Recent in Equities
Can AI’s Benefits Spread Beyond a Handful of Tech Giants?
What Happens When the January Effect Meets Midterm Elections?
Why Traders Are Managing Concentration Risk with Equal Weight S&P 500 Futures
E-mini Russell 2000 Index Futures
The fundamental case for small-cap underperformance was multifaceted and, for a time, compelling. The most pressing concern centered on interest rates. In January 2023, the Federal Reserve’s benchmark rate stood at 4.25%, already elevated by recent historical standards. But with inflation still running hot, markets expected further tightening – and got it. By July 2023, the Fed had raised rates to 5.25%, adding 100 basis points of pressure.
Stocks included in the Russell tend to be extremely sensitive to short-term rates. Many of these smaller companies use revolving rates to conduct business, unlike cash-rich entities like Apple and Google.
Economic uncertainty added another layer of concern. A disappointing 1.3% GDP reading in December 2022 sparked widespread fears of an imminent recession. Although those fears would prove premature – the recession never materialized – the anxiety lingered for several quarters, keeping investors cautious about economically-sensitive small-cap stocks.
This did not seem to stop traders from favoring the Nasdaq over the Russell. Even when the Fed pivoted to cutting rates in the fall of 2024, delivering 100 basis points of easing, the outperformance of the Nasdaq persisted. By then, the narrative appeared to have shifted. Rate sensitivity mattered less than the seemingly unstoppable momentum behind artificial intelligence and the mega-cap stocks positioned to capitalize on it.
By late 2025, however, three significant developments began to alter the equation.
First, the Fed resumed its easing cycle with 75 basis points of cuts. What makes these rate reductions particularly notable is their timing: they are occurring against a backdrop of economic expansion, not weakness.
The Fed’s focus appears to be the labor market, where recent data have shown softening despite otherwise healthy economic indicators. Under its dual mandate of price stability and maximum employment, the central bank is responding to labor market weakness even as other measures suggest the economy remains on solid footing.
Second, the Fed appears to be anticipating that the same AI that’s eliminating jobs might also combat inflation through productivity gains. If true, 2026 could bring a Goldilocks scenario of moderate economic growth, low unemployment and stable inflation – especially with potential tailwinds from tax cuts, deregulation and reshoring investment. Small caps are more sensitive to these domestic factors, as they are less likely than large caps to be doing business across the globe.
Third, AI exuberance itself is showing signs of fatigue. Nvidia shed 20% in early November and the entire Mag 7 lost 10%. While these are minor moves when viewed against their enormous multi-year rallies, they raise a critical question: Has this combination of factors provided enough incentive to cause a rush of liquidation in the long Nasdaq / short Russell trade?
If the answer is yes, and that liquidation has indeed begun, it suggests a path for continued outperformance of the Russell into 2026.
For investors interested in expressing this view, pair trading with Equity Index options enables traders to express relative performance views between indices while maintaining defined risk parameters regardless of overall market direction.
The strategy’s effectiveness hinges on thoughtful position construction, where traders must choose between dollar-neutral weighting – which equalizes notional exposure – or volatility-adjusted weighting that accounts for the historical behavior differences between indices like the Russell 2000 and Nasdaq-100.
By utilizing liquid CME Group Equity options contracts, market participants can structure trades that isolate their conviction about one index outperforming another, transforming directional market views into actionable positions with clear maximum loss thresholds.
—
Originally Posted February 19, 2026 – Small Caps Stage Quiet Comeback as AI Trade Shows Cracks
© [2023] CME Group Inc. All rights reserved. This information is reproduced by permission of CME Group Inc. and its affiliates under license. CME Group Inc. and its affiliates accept no liability or responsibility for the information contained herein, including but not limited to the currency, accuracy and/or completeness of this information, and delays, interruptions, errors or omissions. This information is an unofficial copy and may not reflect the official and accurate version. For the definitive and up-to-date version of any of this information, please see cmegroup.com.
Information posted on IBKR Campus that is provided by third-parties does NOT constitute a recommendation that you should contract for the services of that third party. Third-party participants who contribute to IBKR Campus are independent of Interactive Brokers and Interactive Brokers does not make any representations or warranties concerning the services offered, their past or future performance, or the accuracy of the information provided by the third party. Past performance is no guarantee of future results.
This material is from CME Group and is being posted with its permission. The views expressed in this material are solely those of the author and/or CME Group and Interactive Brokers is not endorsing or recommending any investment or trading discussed in the material. This material is not and should not be construed as an offer to buy or sell any security. It should not be construed as research or investment advice or a recommendation to buy, sell or hold any security or commodity. This material does not and is not intended to take into account the particular financial conditions, investment objectives or requirements of individual customers. Before acting on this material, you should consider whether it is suitable for your particular circumstances and, as necessary, seek professional advice.
Trading options on futures contracts involves substantial risk and is not suitable for all investors. Selling (writing) options on futures exposes the seller to potentially unlimited risk of loss, as the seller may be required to fulfill the terms of the contract if the market moves unfavorably. Losses can exceed the initial margin or premium received. Before engaging in short options strategies on futures, you should carefully consider your financial situation, investment objectives, and risk tolerance. You must fully understand the risks involved, including the possibility of losing more than your initial investment. The Commodity Futures Trading Commission (CFTC) and the National Futures Association (NFA) require that you receive and review the Options Disclosure Document (ODD) before trading options on futures. This document explains the characteristics and risks of options trading.
Futures are not suitable for all investors. The amount you may lose may be greater than your initial investment. Before trading futures, please read the CFTC Risk Disclosure. A copy and additional information are available at ibkr.com.
Related Articles


")


Join The Conversation
For specific platform feedback and suggestions, please submit it directly to our team using these instructions.
If you have an account-specific question or concern, please reach out to Client Services.
We encourage you to look through our FAQs before posting. Your question may already be covered!