
- Solve real problems with our hands-on interface
- Progress from basic puts and calls to advanced strategies
Interactive Options Course

Posted September 10, 2025 at 10:15 am
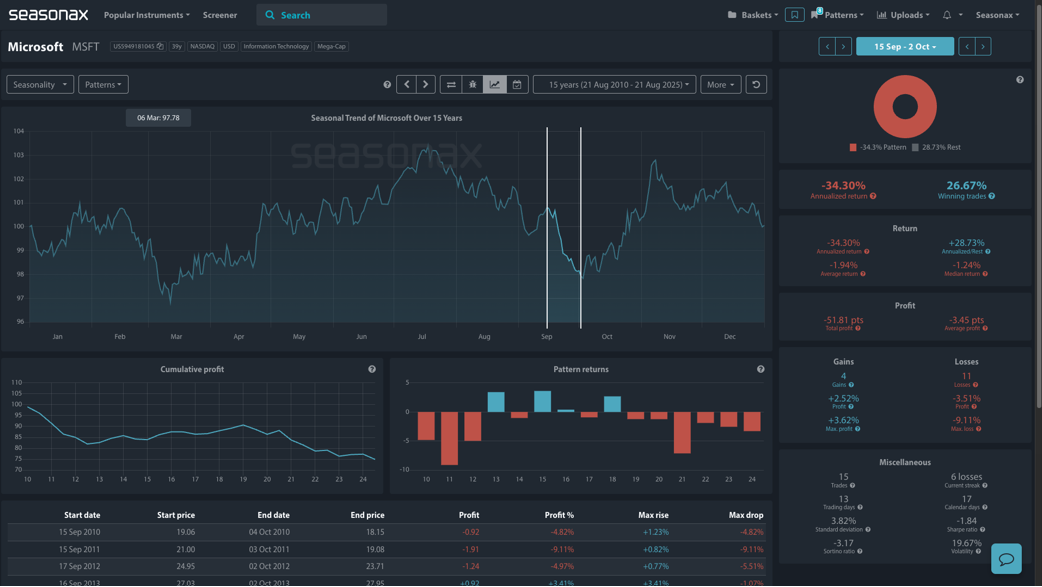
Microsoft became the second company in the world to surpass a $4 trillion market cap this summer, propelled by a blockbuster earnings report and renewed investor confidence in its AI leadership. But as we move into mid-September, one of Microsoft’s weakest seasonal windows begins. With the stock extending this summer, up to more than 60% since its April low, could it now be due for a further breather?
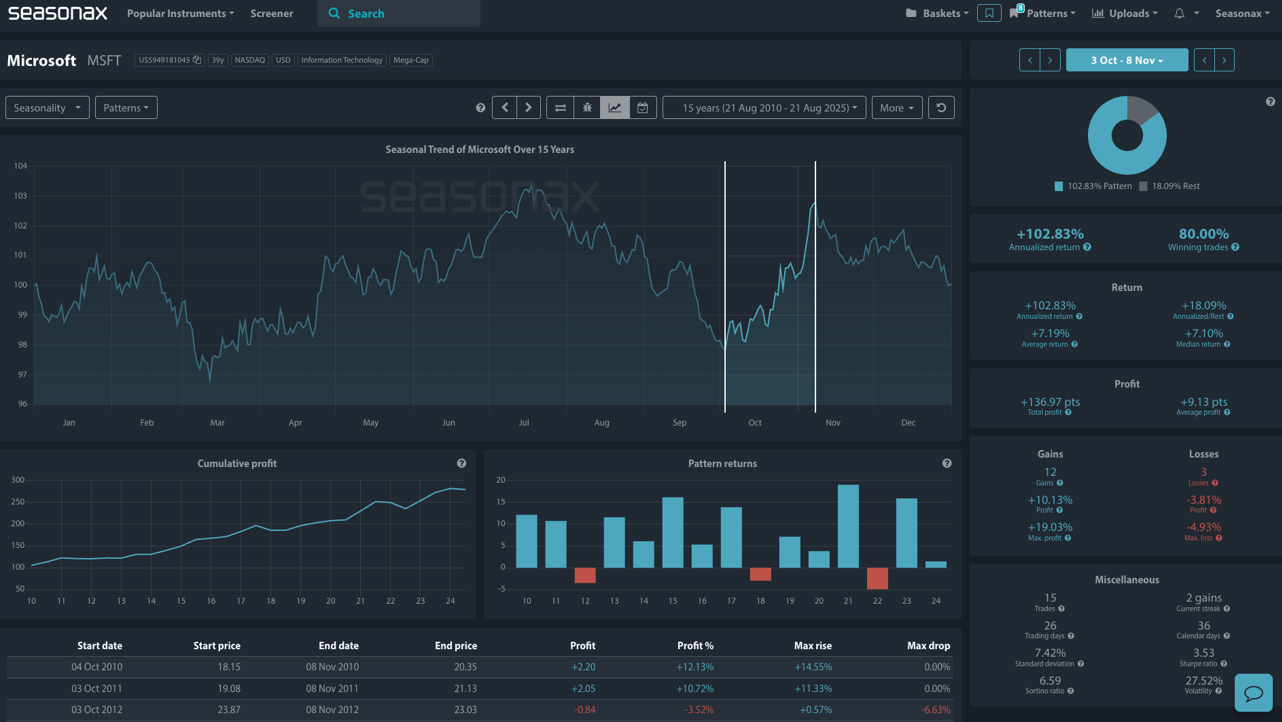
Let’s examine the seasonal pattern in more detail.
The detrended seasonal chart below shows that over the last 15 years, Microsoft shares have historically delivered an average loss of –1.94% between 10 September and 3 October, with a low 26.67% win rate. Seasonax’s detrended chart removes overarching trends, allowing us to see that this period has produced losses in 11 of the last 15 years, even during strong years for tech. It’s a caution worth noting—especially when the fundamentals appear overwhelmingly positive.
Microsoft’s Q2 earnings results smashed expectations:
When announced, at the end of July, these numbers sparked a rally of more than 8% in a single session, catapulting Microsoft above the $4 trillion mark and pushing the Nasdaq 100 (where Microsoft holds a 12.46% weighting) to new highs.
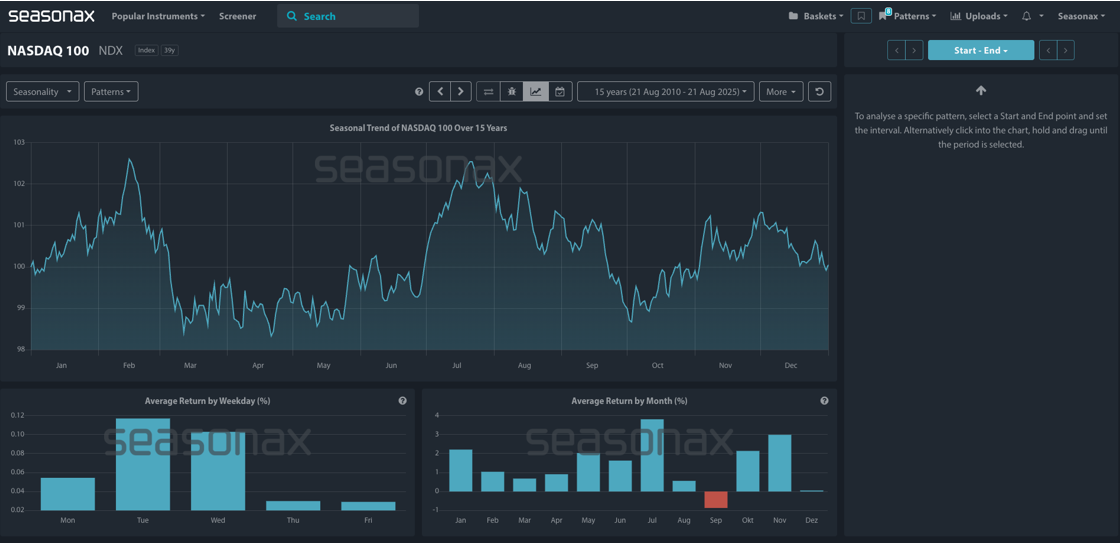
But this rally comes with elevated risks. The broader Magnificent Seven stocks have led the market higher in recent months, and with momentum now stretched, even strong performers like Microsoft could be vulnerable to a further pullback—particularly when history suggests this is a seasonally weak stretch. Note below that the only month the Nasdaq has a negative average return in the last 15 years has been during the month of September (see the only red bar on the bar chart below).
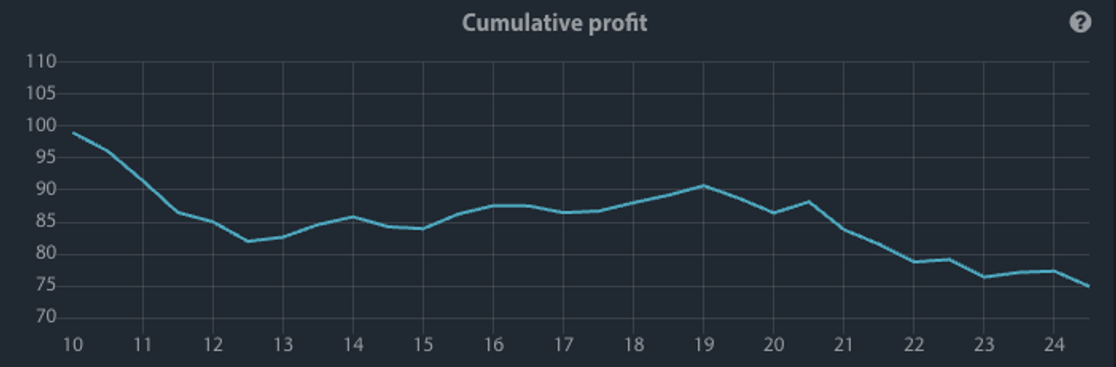
Furthermore, Seasonax’s cumulative profit curve for this time period confirms the risk for Microsoft. The cumulative return curve shows the total result of buying Microsoft in this window each year over the 14-year history – and the picture is clearly a negative drift lower.
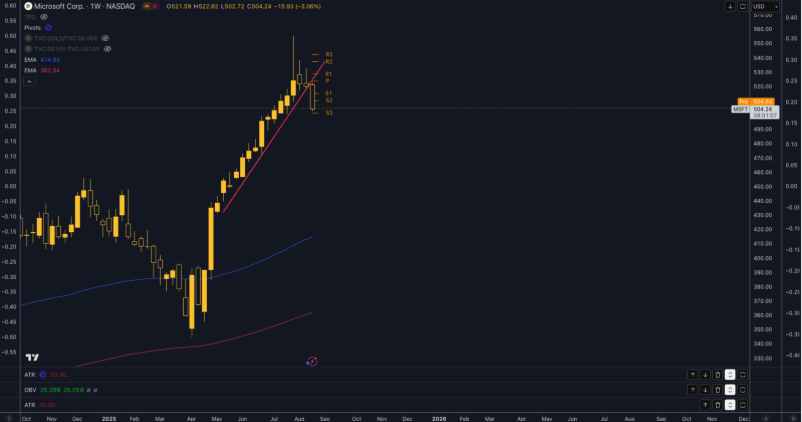
From a technical perspective, Microsoft is now trading significantly above its 100 (blue line) and 200‑day (red line) EMAs. However, the post earnings surge up to 550 has clearly been rejected with clear tailing price action shown on the weekly chart. Moreover, the weekly trend line (marked red) has also been broken lower on a clear momentum change in the middle of August suggesting a potential near term trend change that could potentially be underway, which would also coincide with a weak seasonal period ahead. The key area to watch for sellers would be any selling from the $520 region with a potential re-test of the underside of the broken trend line a likely catalyst for short term sellers.
Microsoft’s long-term growth story remains intact. But in the short term, this seasonal window has historically delivered poor performance. With the stock up sharply and optimism running high, traders should remain alert for signs of reversal, especially if bond yields rise or a surge on US inflation or further profit-taking kicks in.
A more conservative approach for those reluctant to be a seller might be to wait for a pullback, in line with the seasonal dip, and look to re-enter as we head into October. Microsoft’s return in October has been an impressive average of 7.19% over the last 15 years between October 03 and November 08. As always, use protective stops and consider the broader context – Microsoft is a leader in AI, but even leaders need to rest. However, seasonality shows you that there can be a multi-dimensional approach to using seasonality in your trading.
Use Seasonax for your professional handling of market-moving events to find stocks poised to move!
—
Originally Posted on September 10, 2025 – Microsoft’s Milestone Meets September’s Struggle: Is Record AI Momentum Over?
Past results and past seasonal patterns are no indication of future performance, in particular, future market trends. Seasonax GmbH neither recommends nor approves of any particular financial instrument, group of securities, segment of industry, analysis interval or any particular idea, approach, strategy or attitude nor provides consulting nor brokerage nor asset management services. Seasonax GmbH hereby excludes any explicit or implied trading recommendation, in particular, any promise, implication or guarantee that profits are earned and losses excluded, provided, however, that in case of doubt, these terms shall be interpreted in abroad sense. Any information provided by Seasonax GmbH or on this website or any other kind of data media shall not be construed as any kind of guarantee, warranty or representation, in particular as set forth in a prospectus. Any user is solely responsible for the results or the trading strategy that is created, developed or applied. Indicators, trading strategies and functions provided by seasonax GmbH or on this website or any other kind of data media may contain logical or other errors leading to unexpected results, faulty trading signals and/or substantial losses. Seasonax GmbH neither warrants nor guarantees the accuracy, completeness, quality, adequacy or content of the information provided by it or on this website or any other kind of data media. Any user is obligated to comply with any applicable capital market rules of the applicable jurisdiction. All published content and images on this website or any other kind of data media are protected by copyright. Any duplication, processing, distribution or any form of utilisation beyond the scope of copyright law shall require the prior written consent of the author or authors in question. Futures and forex trading contains substantial risk and is not for every investor. An investor could potentially lose all or more than the initial investment. Risk capital is money that can be lost without jeopardizing ones’ financial security or lifestyle. Only risk capital should be used for trading and only those with sufficient risk capital should consider trading. Past performance is not necessarily indicative of future results. Testimonials appearing on this website may not be representative of other clients or customers and is not a guarantee of future performance or success.
Information posted on IBKR Campus that is provided by third-parties does NOT constitute a recommendation that you should contract for the services of that third party. Third-party participants who contribute to IBKR Campus are independent of Interactive Brokers and Interactive Brokers does not make any representations or warranties concerning the services offered, their past or future performance, or the accuracy of the information provided by the third party. Past performance is no guarantee of future results.
This material is from Seasonax and is being posted with its permission. The views expressed in this material are solely those of the author and/or Seasonax and Interactive Brokers is not endorsing or recommending any investment or trading discussed in the material. This material is not and should not be construed as an offer to buy or sell any security. It should not be construed as research or investment advice or a recommendation to buy, sell or hold any security or commodity. This material does not and is not intended to take into account the particular financial conditions, investment objectives or requirements of individual customers. Before acting on this material, you should consider whether it is suitable for your particular circumstances and, as necessary, seek professional advice.
Related Articles


Join The Conversation
For specific platform feedback and suggestions, please submit it directly to our team using these instructions.
If you have an account-specific question or concern, please reach out to Client Services.
We encourage you to look through our FAQs before posting. Your question may already be covered!