
- Solve real problems with our hands-on interface
- Progress from basic puts and calls to advanced strategies
Interactive Options Course

Posted June 3, 2025 at 1:00 pm
About three weeks ago we did a study that attributed whether gains in the S&P 500 (SPX) were coming primarily during US or overnight trading hours. We learned that for the course of the year to that date, we had gains during regular trading hours and losses overnight. This was in sharp contrast to the prior year, when nearly all the index’ gains occurred during overnight sessions. (See the “Since 1.1.25” and “Calendar 2024” lines in the table below.) After a few days where SPX staged rallies throughout the main session, in some cases after some quick pullbacks, we wanted to see if this pattern held.
For reference, here is the original table below, published on May 15th, with data through May 9th. We used SPY, an ETF based upon SPX, because it has better defined opening levels than the index itself:
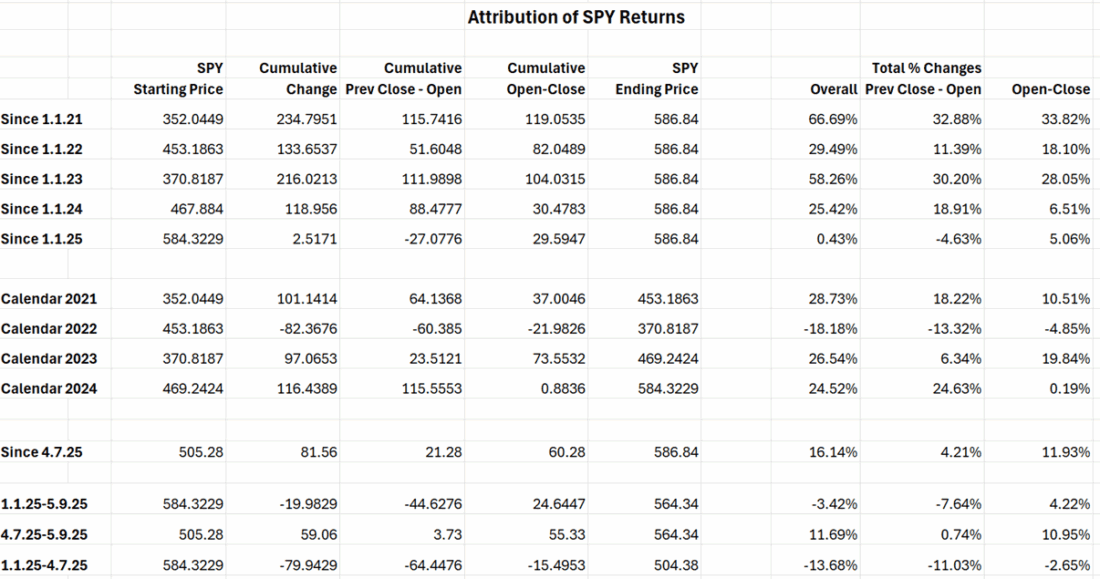
Source: Interactive Brokers
After updating the some of the most recent data, we see that the gains are becoming a bit more balanced in the past month. Note the contrast between the “Since 4.7.25” row and the results since May 1st in the table below:
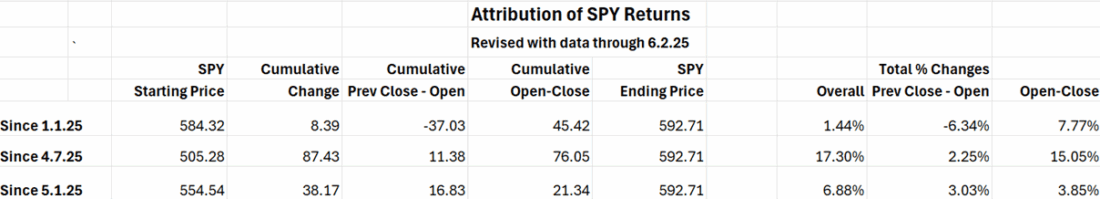
Source: Interactive Brokers
Had we included today’s intraday results, it would have skewed the numbers somewhat more to the Open-Close column, since we opened roughly flat, then steadily rose throughout the session. Regardless, we can see that while the bulk of the gains this year have come from regular day trading – indicating that US buyers were in charge – the imbalance improved markedly in May.
Adding to the “US buyers in charge” idea was a question posed by reader in a comment to yesterday’s piece:
Here is another pattern for Steve to explain: Please deconstruct the flurry of activity at 3:50 PM Eastern time. It happens precisely at that time – down to he second. And why, at least initially, is it filled with massive index buying at least 87% of the time?
I haven’t been able to verify those exact statistics yet, but I have noticed the tendency of SPX to rise just before the end of the session. That is the result of market-on-close orders from funds that have been seeing inflows in ETFs and other funds that are either linked directly to SPX, or that contain a heavy weight in SPX components. Funds that are linked to an index are marked at that index’ close. Also, the performance of institutional buyside traders is often linked to some combination of the volume weighted average price (VWAP) and the close. Thus, if the fund has been seeing steady inflows, it behooves the institutional trader to leave some extra buying ammunition for the close.
Because institutional market-on-close orders must be received well before the close, the NYSE and Nasdaq publish market-on-close imbalances at 3:50 each day. This allows all market participants to get a sense about whether there is likely to be a final surge of order flow in one direction or another. The logic is to allow traders to be able to get prepared ahead of potential market volatility and hopefully dampen its effect on the close. In practice, however, some traders of course try to game the system. On a day like yesterday or Friday, the first trading day of the new month and the last day of the prior, it is reasonable to expect either more inflows or some window dressing of positions. Yesterday, the bounce was very late, starting at about 3:57. On Friday, the bounce started at 3:00, with the final trades actually falling from the 3:57 level, but finishing nicely above the 3:00 level. Either way, the late bounces don’t occur unless funds are seeing inflows.
New to Interactive Brokers?
Open AccountAlready an Interactive Brokers Client?
Request Trading PermissionThe analysis in this material is provided for information only and is not and should not be construed as an offer to sell or the solicitation of an offer to buy any security. To the extent that this material discusses general market activity, industry or sector trends or other broad-based economic or political conditions, it should not be construed as research or investment advice. To the extent that it includes references to specific securities, commodities, currencies, or other instruments, those references do not constitute a recommendation by IBKR to buy, sell or hold such investments. This material does not and is not intended to take into account the particular financial conditions, investment objectives or requirements of individual customers. Before acting on this material, you should consider whether it is suitable for your particular circumstances and, as necessary, seek professional advice.
The views and opinions expressed herein are those of the author and do not necessarily reflect the views of Interactive Brokers, its affiliates, or its employees.
Any discussion or mention of an ETF is not to be construed as recommendation, promotion or solicitation. All investors should review and consider associated investment risks, charges and expenses of the investment company or fund prior to investing. Before acting on this material, you should consider whether it is suitable for your particular circumstances and, as necessary, seek professional advice.
For specific platform feedback and suggestions, please submit it directly to our team using these instructions.
If you have an account-specific question or concern, please reach out to Client Services.
We encourage you to look through our FAQs before posting. Your question may already be covered!
Related Articles


You really know what’s causing the weirdness during the day. It’s the options dealers. They now are so aggressive in gamma chase, that they will do anything in their power to keep their sells on the right side. Delta neutrality is a myth they use to justify their jobs, when we are all aware the CBOE could set up their own computerized system that was truly fair. Eliminate the dealer, save the markets.
Check the dark pools.
Isn’t the Market-On-Close imbalance published at 3:50 pm sharp, and this leads to the short spike in trading activity? I’ve always assumed that the spike is created by market makers adjusting their inventory for the MOC orders.
This market phenomenon was evident in the 1980″s also. I used to take Friday’s off and go with my rich friend and make a few hundred dollars in the last hour of trading. Who ever won the most would buy dinner!
According to Google: The NYSE and Nasdaq both publish market-on-close (MOC) imbalance information at 3:50 PM Eastern Time (ET). The NYSE disseminates this data every five seconds until 4:00 PM ET. Nasdaq begins publishing imbalance information at 3:50 PM ET and continues until 4:00 PM ET.
Thanks to readers for pointing out a crucial typo. MOC indications are indeed published at 3:50, not 3:40 as typed. Fixing now