
- Solve real problems with our hands-on interface
- Progress from basic puts and calls to advanced strategies
Interactive Options Course
Posted December 8, 2025 at 1:00 pm
I always enjoy getting questions about something I’m already working on. It turns out that I was in the process of figuring out how best to display the apparent relationship between the probability of a Fed Funds cut and stocks when a call came in this morning. Though they have been moving in lockstep for weeks, we need to consider what might drive stocks after Wednesday’s meeting.
About two weeks ago, I created a chart that displayed December Fed Funds Futures (ZQ) versus December S&P 500 E-mini Futures (ES). The relationship is quite clear, but the magnitudes of the changes in Fed Funds expectations are not intuitive. We typically talk about the probability for a cut, whether it is in terms of the CME FedWatch or prediction markets like ForecastEx; while the price of ZQ is clearly the key determinant of those probabilities, it requires a bit of arithmetic to translate those futures prices into rate cut probabilities.
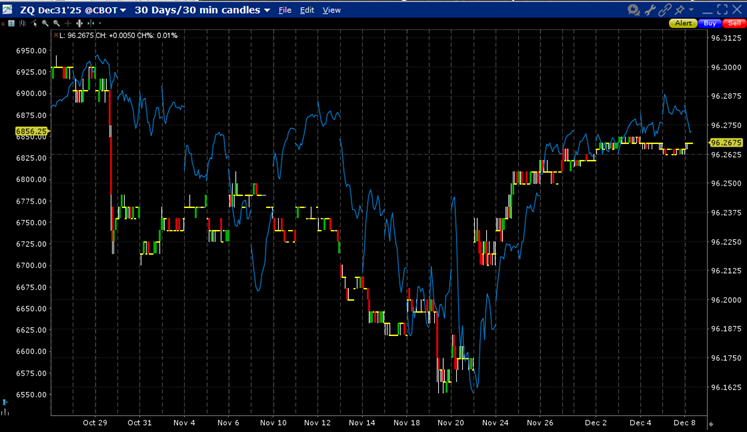
Source: Interactive Brokers
Using an external source, I was able to display the actual probability alongside the S&P 500 (SPX) and Nasdaq 100 (NDX). The relationship is just as vivid, but a bit easier to interpret. Put simply, as the probability slipped definitively below 60%, stocks fell. Stocks rebounded on November 20th when the probability returned to a level above 60% after New York Fed President Williams indicated that he would favor a cut this week and continued their advance relatively unabated as the probability rose.
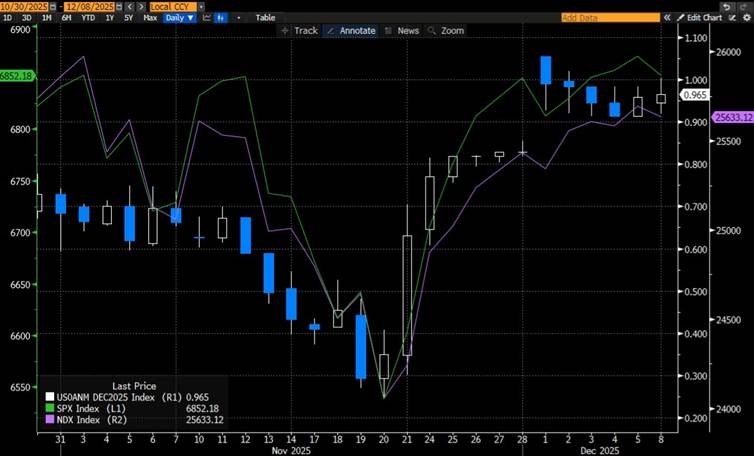
Source: Bloomberg
While this is a solid explanation of what has happened recently, it offers no clue about what might happen in the coming days and weeks. For starters, we have no choice but to abandon the use of a December rate cut probability after Wednesday’s FOMC meeting when it will become, by definition, old news. Also, today’s relatively modest decline might be somewhat attributed to a lack of consensus and clarity about Fed policy in the months to come.
I have heard the term “hawkish cut” mentioned quite a bit recently. The implication is that Chair Powell will acknowledge the desirability, if not the necessity, of a cut at present but question the need for them at upcoming meetings. It is no coincidence that the last all-time closing high for SPX was on October 28th – the day before the last FOMC meeting – when Powell did something similar. It would be easy for him to lean into the idea of data dependency amidst the current paucity of government statistics.
Although there is plenty of discussion about a hawkish cut, it may already be priced into market expectations. Probabilities for the next three meetings are currently in the 20-30% range, indicating that fixed income traders, if not stock traders, are skeptical about the prospect for near-term cuts. With expectations that low, it is easier to make a case for them increasing than retreating further. Some positive rhetoric from the Chair or a changing “dot plot” could provide a boost.
Remember also that the market will increasingly view Chair Powell as a “lame duck” whose opinions will carry diminishing weight in the New Year. His term ends in May and may end sooner because it is customary for Fed Chairs to step down when their successor is confirmed by Congress. Chairs Bernanke, Yellen, and Powell all took office in February (2006, 2014, 2018, respectively) for that reason.
Finally, it is hard to imagine that traders are not already gearing up for a “Santa Claus” rally. It is not a foregone conclusion that we will get a rally between now and year-end, but if the “don’t short a dull tape” experience of Thanksgiving week was any indication, then it is not unreasonable to foresee a similar performance into year-end.
But there is one very important warning sign to be gleaned from the chart above: while SPX is within a whisker of a new closing high, NDX is about 2% below its own all-time high of October 29th. In some respects, this is positive because it means that investors are looking beyond megacap tech to other sectors. But I think of the experience of late 2021-early 2022, when SPX rallied to an all-time on the first trading day of 2022, but NDX never matched its high set on November 19th, 2021. Neither recovered those levels until late 2023. It could of course just be a coincidence, but as we pointed out last week, there are a series of inconvenient factors that could converge in 2026.
New to Interactive Brokers?
Open AccountAlready an Interactive Brokers Client?
Request Trading PermissionThe analysis in this material is provided for information only and is not and should not be construed as an offer to sell or the solicitation of an offer to buy any security. To the extent that this material discusses general market activity, industry or sector trends or other broad-based economic or political conditions, it should not be construed as research or investment advice. To the extent that it includes references to specific securities, commodities, currencies, or other instruments, those references do not constitute a recommendation by IBKR to buy, sell or hold such investments. This material does not and is not intended to take into account the particular financial conditions, investment objectives or requirements of individual customers. Before acting on this material, you should consider whether it is suitable for your particular circumstances and, as necessary, seek professional advice.
The views and opinions expressed herein are those of the author and do not necessarily reflect the views of Interactive Brokers, its affiliates, or its employees.
Futures are not suitable for all investors. The amount you may lose may be greater than your initial investment. Before trading futures, please read the CFTC Risk Disclosure. A copy and additional information are available at ibkr.com.
Interactive Brokers LLC is a CFTC-registered Futures Commission Merchant and a clearing member and affiliate of ForecastEx LLC (“ForecastEx”). ForecastEx is a CFTC-registered Designated Contract Market and Derivatives Clearing Organization. Interactive Brokers LLC provides access to ForecastEx Forecast Contracts for eligible customers. Interactive Brokers LLC does not make recommendations with respect to any products available on its platform, including those offered by ForecastEx.
For specific platform feedback and suggestions, please submit it directly to our team using these instructions.
If you have an account-specific question or concern, please reach out to Client Services.
We encourage you to look through our FAQs before posting. Your question may already be covered!
Related Articles


I was just trying to cash out all my assets can you help me with that
I can help, I can break a $20.
Hello, thank you for asking. To convert your entire portfolio to cash, please review this FAQ: https://www.interactivebrokers.com/faq?id=34478481
We hope this helps!
why would you ever do that?
Fed Funds Drove SPX. Now What Is Driving the Markets Higher?
On a more serious note, hedging into the Fed announcement (liquidating parts of positions, trading options) seems like the cautious approach at this point, since the market could move significantly either direction based on what Powell says, which is pretty impossible to predict at this point.
Print, Borrow, BUY……its avery complicated policy….