
- Solve real problems with our hands-on interface
- Progress from basic puts and calls to advanced strategies
Interactive Options Course
Posted May 16, 2025 at 10:56 am
1/ Revisiting the “Ducks”
2/ WWDKD? What would David Keller, CMT do?
3/ NAAIM Exposure Index Update
Investopedia is partnering with CMT Association on this newsletter. The contents of this newsletter are for informational and educational purposes only, however, and do not constitute investing advice. The guest authors, which may sell research to investors, and may trade or hold positions in securities mentioned herein do not represent the views of CMT Association or Investopedia. Please consult a financial advisor for investment recommendations and services.
Revisiting the “Ducks”
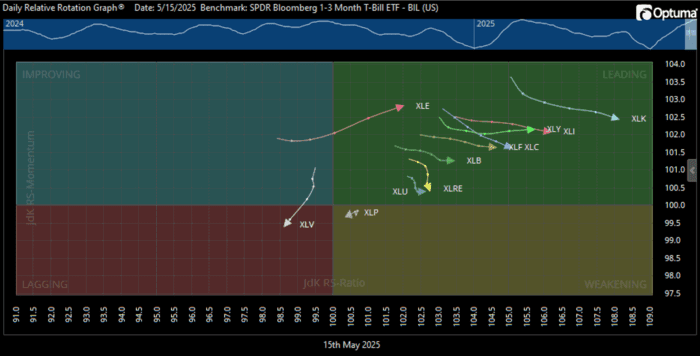
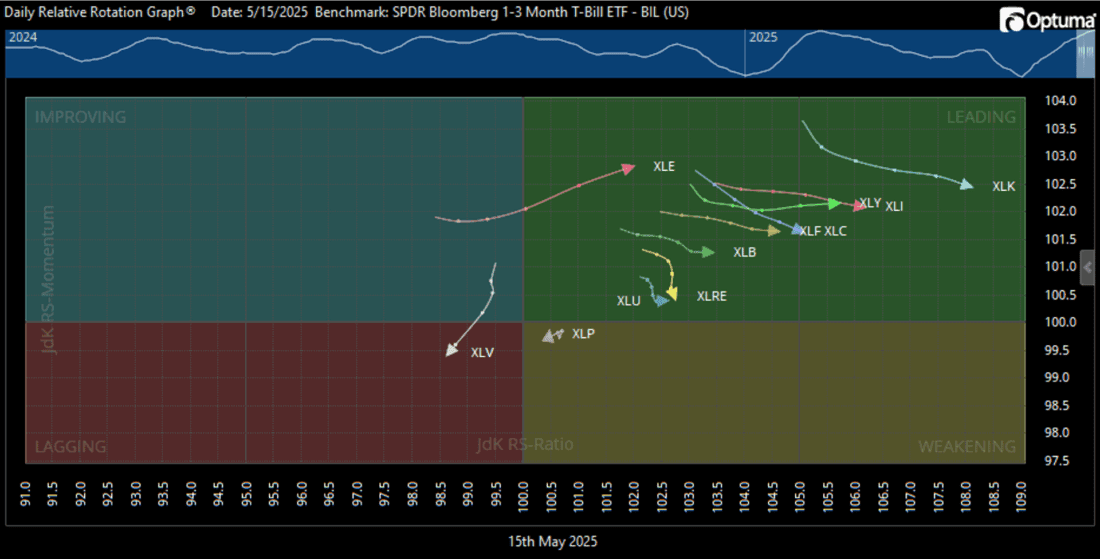
When we started this week, many sectors of the S&P 500 had already pushed into the Green (Leading) box and the two sectors that looked rough were Consumer Staples (XLP) and Healthcare (XLV). And if you’ve been following me this week, you heard that the Healthcare sector continued to have a rough time and the news didn’t do it any favors.
One of my favorite things about RRG Charts (under normal market circumstances) is how they give decent guidance as to where parts of the market are moving. And in the case of Healthcare, the news that came out just confimred what we were already seeing in the charts and RRG rotation.
XLV aside, I also suggested a pullback (or at least a pause) was likely to happen soon, but we didn’t see it this week. What I’m still watching for is to see the bulk of the sectors in the Green (Leading) box start to push down and into the Yellow (Weakening) box. Seeing weakness across many sectors at the same time, to me, gives a great hint on the broad market’s direction in the near future – think 5-10 days forward.
What that could mean is, if you’re sitting on some good gains that you picked up near the market bottom a few weeks ago, soon it could be time to do some trimming and lock in some profits. But the market can still run from here, so there is no need to be too hasty in selling. Keep the broad market context in mind and follow your exit signals.
WWDKD? What would David Keller, CMT do?
Long ago I saw David Keller, CMT use this chart in a presentation and have been using it ever since.
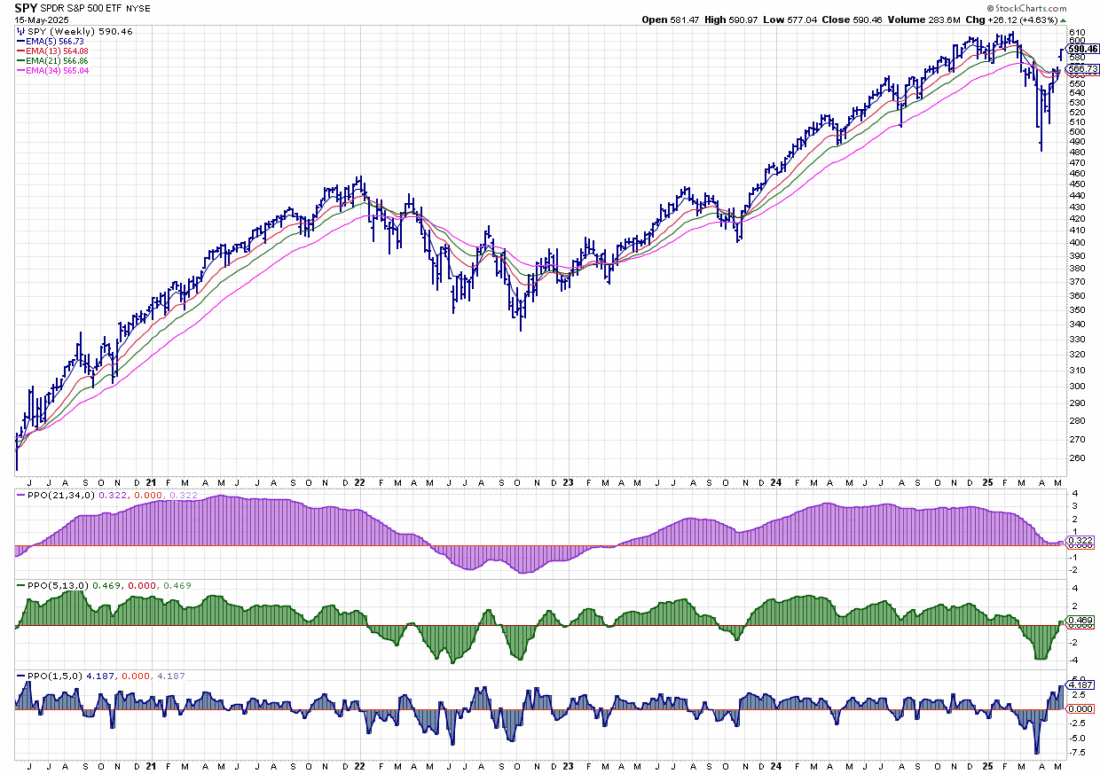
If you look really closely at this weekly chart of the S&P 500 ETF (SPY), you can see that this week had a nice break-out above the confluence of several moving averages (in this case, the 13, 21, and 34 exponential moving averages). Going back to my RRG chart, there was a very real possibility that this index could have failed to break above this area of resistance. But it did.
The three Percentage Price Oscillators (PPOs) at the bottom show three time-frame variations: Slow (purple), Medium (Green), and Blue (Fast). It’s like looking at multiple timeframe charts in one place, so it saves a lot of time. What I found interesting about this last pullback was that it never pushed the longer-term PPO below Zero. So when the faster signals started to turn positive, they were worth paying attention to.
So what would David Keller, CMT do? I would think he’d be scanning for the next price level to take action. I’m not completely sure, but this is a great chart to have on your list.
NAAIM Exposure Index Update
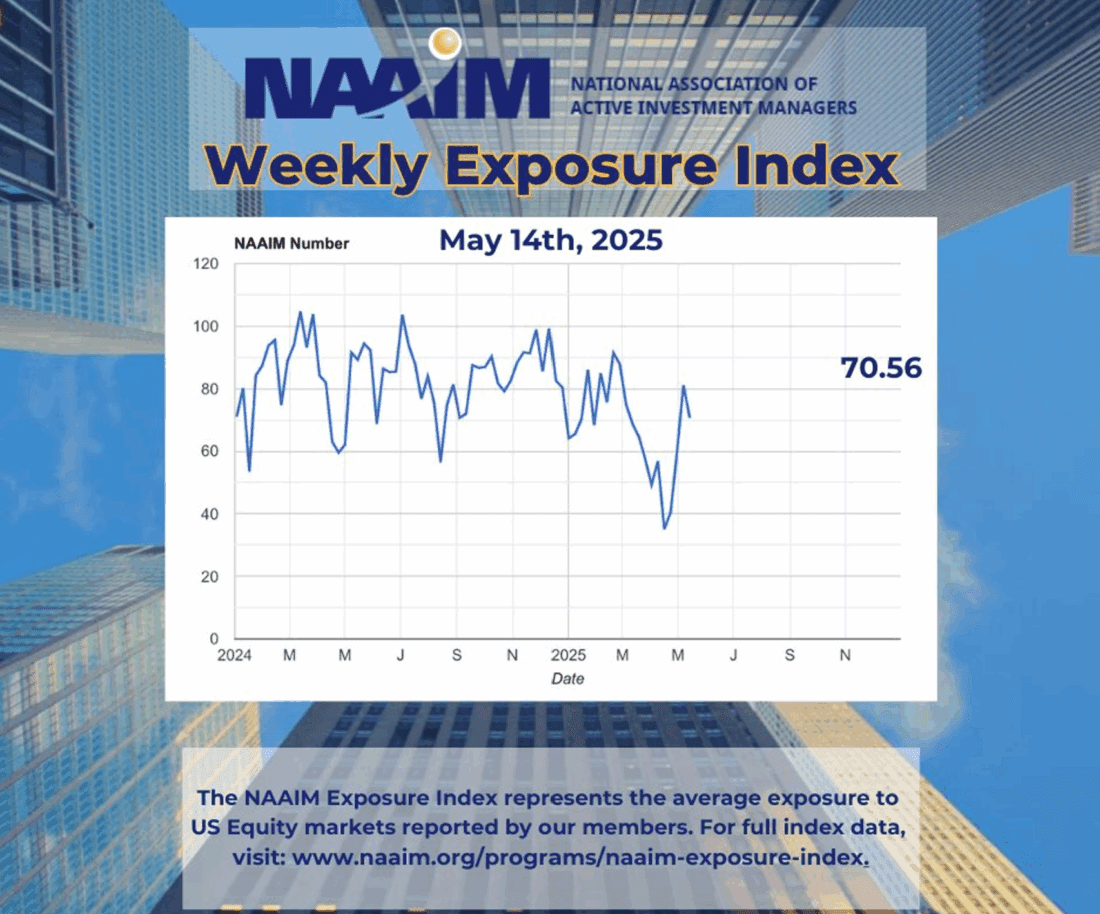
This week’s NAAIM Exposure Number came in at 70.56, which was (again) lower than my reported 95. I’ve been posting numbers that have far exceeded the general index number over the past several weeks and I’ve been a little surprised to see so many active managers late to this party.
One of the useful aspects of this index is noting when it dips below 60, as that tends to be a place of interest as to when start looking for an entry. However, this tactic is less favorable when the S&P 500 is below a longer-term moving average (like a 200-day or a 40-week, depending on your preferred chart).
Since the S&P 500 has been below these moving averages since early to mid-March, this signal hasn’t been noteworthy. However, as of this week, the S&P 500 has moved back above both of these hurdles. So we’re back to game-on if these moving averages hold and the NAAIM Exposure Index dips back below the 60 level.
And finally, I’d like to thank Investopedia and the CMT Association for having me back as a guest contributor. It’s been a lot of fun (and a lot of work), but I’ve enjoyed sharing so much of what I think about on a daily basis when looking at the markets. Hopefully you were able to pick up something from my approach to technical analysis and investing in general. But now it’s Friday, so be like David Keller, CMT and celebrate the week with some pizza.
Happy Friday and Stay Safe out there!!
—
Originally posted 16th May 2025
Investopedia.com: The comments, opinions and analyses expressed herein are for informational purposes only and should not be considered individual investment advice or recommendations to invest in any security or to adopt any investment strategy. While we believe the information provided herein is reliable, we do not warrant its accuracy or completeness. The views and strategies described on our content may not be suitable for all investors. Because market and economic conditions are subject to rapid change, all comments, opinions and analyses contained within our content are rendered as of the date of the posting and may change without notice. The material is not intended as a complete analysis of every material fact regarding any country, region, market, industry, investment or strategy. This information is intended for US residents only.
Information posted on IBKR Campus that is provided by third-parties does NOT constitute a recommendation that you should contract for the services of that third party. Third-party participants who contribute to IBKR Campus are independent of Interactive Brokers and Interactive Brokers does not make any representations or warranties concerning the services offered, their past or future performance, or the accuracy of the information provided by the third party. Past performance is no guarantee of future results.
This material is from Investopedia and is being posted with its permission. The views expressed in this material are solely those of the author and/or Investopedia and Interactive Brokers is not endorsing or recommending any investment or trading discussed in the material. This material is not and should not be construed as an offer to buy or sell any security. It should not be construed as research or investment advice or a recommendation to buy, sell or hold any security or commodity. This material does not and is not intended to take into account the particular financial conditions, investment objectives or requirements of individual customers. Before acting on this material, you should consider whether it is suitable for your particular circumstances and, as necessary, seek professional advice.
Any discussion or mention of an ETF is not to be construed as recommendation, promotion or solicitation. All investors should review and consider associated investment risks, charges and expenses of the investment company or fund prior to investing. Before acting on this material, you should consider whether it is suitable for your particular circumstances and, as necessary, seek professional advice.
Related Articles


Join The Conversation
For specific platform feedback and suggestions, please submit it directly to our team using these instructions.
If you have an account-specific question or concern, please reach out to Client Services.
We encourage you to look through our FAQs before posting. Your question may already be covered!