
- Solve real problems with our hands-on interface
- Progress from basic puts and calls to advanced strategies
Interactive Options Course
Posted April 9, 2025 at 9:30 am
From SIA Charts
1/ WNS Holdings Ltd ADR (WNS)
2/ Candlestick Chart
3/ Point and Figure Chart
Investopedia is partnering with CMT Association on this newsletter. The contents of this newsletter are for informational and educational purposes only, however, and do not constitute investing advice. The guest authors, which may sell research to investors, and may trade or hold positions in securities mentioned herein do not represent the views of CMT Association or Investopedia. Please consult a financial advisor for investment recommendations and services.
WNS Holdings Ltd ADR (WNS)
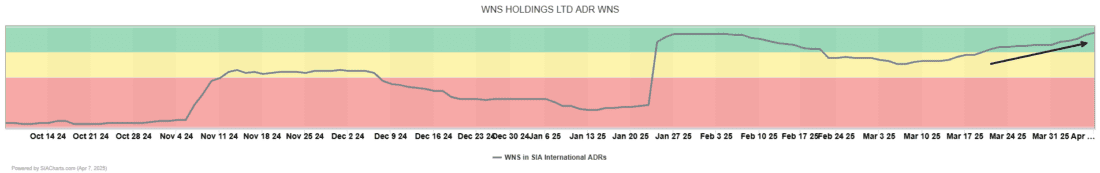
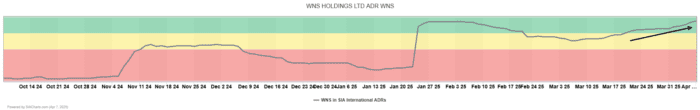
Shares of WNS Holdings have once again percolated to the top of the SIA International ADR Index Report, which extensively captures the new SIA-favored asset class: international equity. In the attached SIA matrix position chart, shares of WNS re-entered the favored zone of the SIA International ADR Index Report in early 2025. As they built relative strength during this period, they are now rallying to position #18, up 70 spots in the past month alone and gaining 26.94% year-to-date, well ahead of any benchmark.
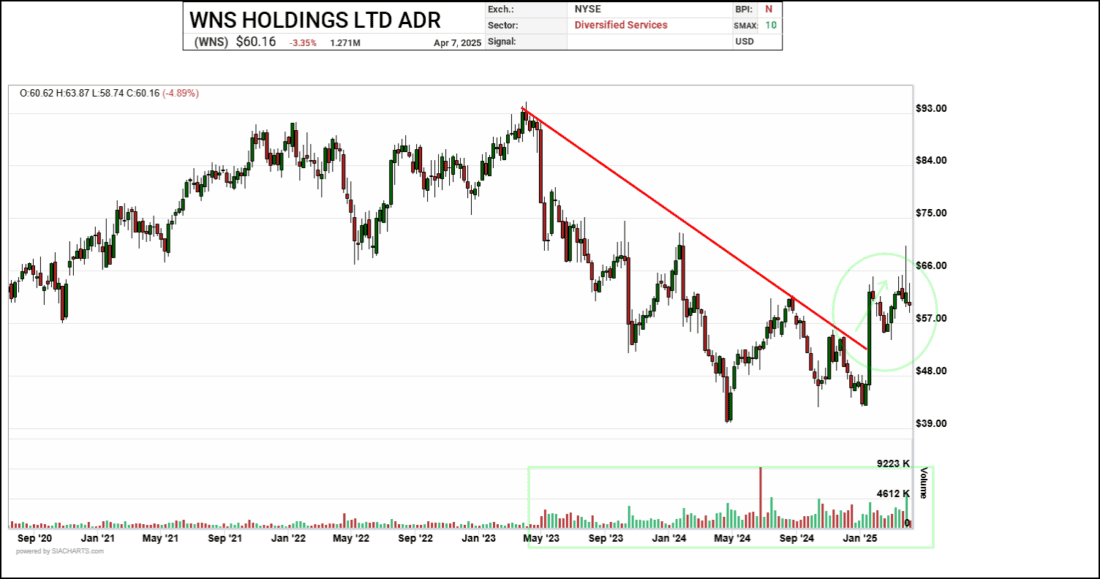
Candlestick Chart
In the attached weekly candlestick chart, which dates back to 2020, we have drawn an apparent downslope line in red that plagued the shares since 2023. However, the last action circled in green appears to have broken this intermediate downtrend, potentially alleviating the technical power struggle against the sellers. Volume is also highlighted in the chart, where a marked improvement might signal renewed interest in this USA/India-headquartered company.
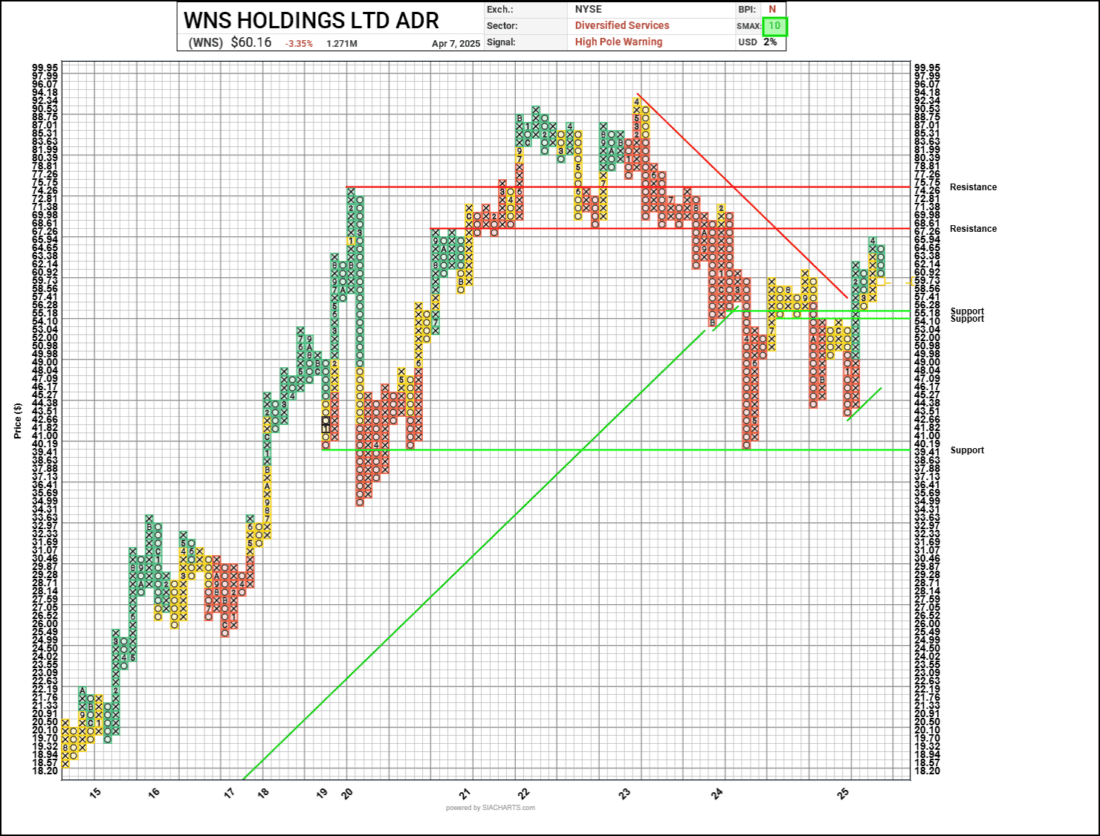
Point and Figure Chart
The final chart presented is the SIA point-and-figure chart, scaled at 2% for an investment-grade technical analysis of WNS shares. Here, we can visualize the declines from the peak of $92.34 in the spring of 2022, as denoted by the red downslope line. Shares found support at $39.41 as buyers and sellers duked it out through 2024, but the buyers appear to be taking control. Shares of WNS have once again turned to a positive trend and rallied through the resistance that had formed in 2024 around the $60 mark. In doing so, the shares have now completed a point-and-figure catapult formation and rallied to near new resistance at $68.61, which dates back to 2020, with additional resistance at $75.75 from 2019. However, most notable is that the shares are improving on a relative basis, observable through the SIA overlay tool. This tool allows us to visually see WNS’s changing position within the SIA International ADR Index Report, where the shares have again turned green, denoting their favored position. Support now looks to be at $55.18, with the bottom green line adding another support level at $39.41. Finally, the SIA SMAX score shows a perfect near-term reading of 10 out of 10, which may further support this relative strength gainer against a basket of other asset classes. WNS (Holdings) Limited, founded in 1996 and headquartered in Mumbai, India, is a global leader in business process management, offering a wide range of services across industries such as healthcare, banking, telecommunications, and more. The company provides solutions in areas such as finance and accounting, customer experience, research and analytics, and digital transformation, helping businesses improve efficiency and stay competitive. Additionally, WNS offers specialized services in automobile claims handling, repair management, and accident management through a network of third-party centers.
—
Originally posted 9th April 2025
Investopedia.com: The comments, opinions and analyses expressed herein are for informational purposes only and should not be considered individual investment advice or recommendations to invest in any security or to adopt any investment strategy. While we believe the information provided herein is reliable, we do not warrant its accuracy or completeness. The views and strategies described on our content may not be suitable for all investors. Because market and economic conditions are subject to rapid change, all comments, opinions and analyses contained within our content are rendered as of the date of the posting and may change without notice. The material is not intended as a complete analysis of every material fact regarding any country, region, market, industry, investment or strategy. This information is intended for US residents only.
Information posted on IBKR Campus that is provided by third-parties does NOT constitute a recommendation that you should contract for the services of that third party. Third-party participants who contribute to IBKR Campus are independent of Interactive Brokers and Interactive Brokers does not make any representations or warranties concerning the services offered, their past or future performance, or the accuracy of the information provided by the third party. Past performance is no guarantee of future results.
This material is from Investopedia and is being posted with its permission. The views expressed in this material are solely those of the author and/or Investopedia and Interactive Brokers is not endorsing or recommending any investment or trading discussed in the material. This material is not and should not be construed as an offer to buy or sell any security. It should not be construed as research or investment advice or a recommendation to buy, sell or hold any security or commodity. This material does not and is not intended to take into account the particular financial conditions, investment objectives or requirements of individual customers. Before acting on this material, you should consider whether it is suitable for your particular circumstances and, as necessary, seek professional advice.
Related Articles


 News")


Join The Conversation
For specific platform feedback and suggestions, please submit it directly to our team using these instructions.
If you have an account-specific question or concern, please reach out to Client Services.
We encourage you to look through our FAQs before posting. Your question may already be covered!