
- Solve real problems with our hands-on interface
- Progress from basic puts and calls to advanced strategies
Interactive Options Course
Posted March 21, 2025 at 11:48 am
1/ Volatility Swings and Trend
Investopedia is partnering with CMT Association on this newsletter. The contents of this newsletter are for informational and educational purposes only, however, and do not constitute investing advice. The guest authors, which may sell research to investors, and may trade or hold positions in securities mentioned herein do not represent the views of CMT Association or Investopedia. Please consult a financial advisor for investment recommendations and services.
Volatility Swings and Trend
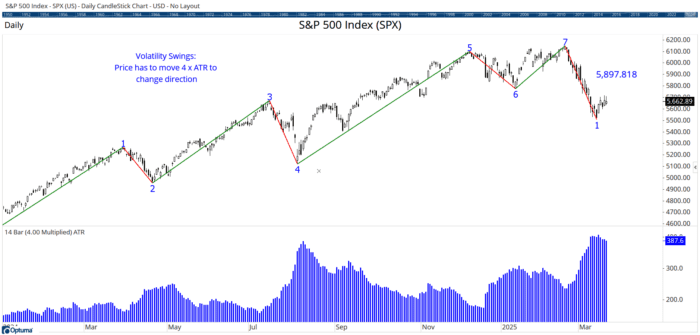
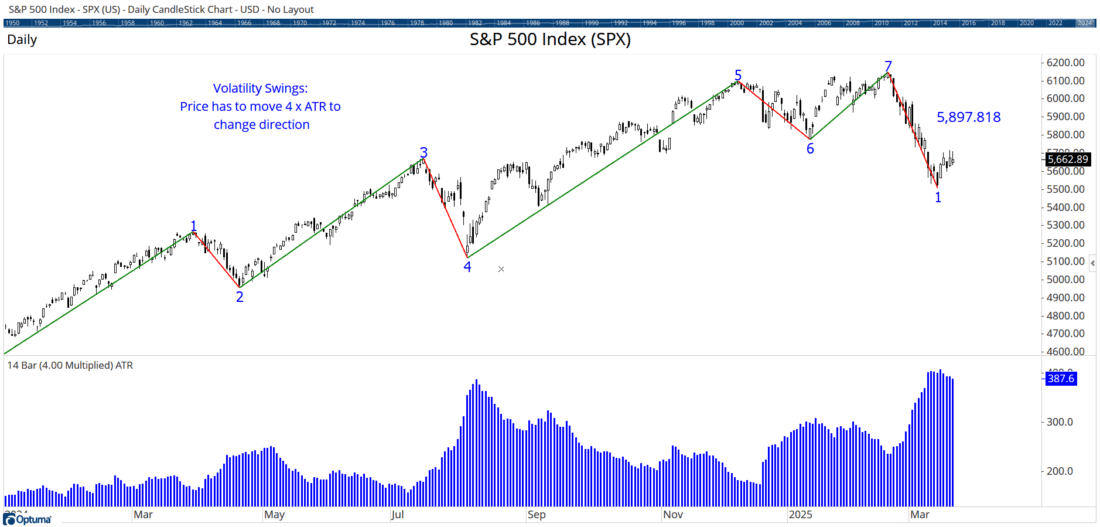
Using a swing chart/overlay is an awesome way to determine trend. There are only two options (up or down) but there are many calculations that can be used to determine the swing direction, from points or percent retraced through to higher / lower bar relationships as introduced by WD Gann. No matter how they are calculated, we can use them as our guide to only trade with the primary trend.
One way to determine the swing direction is by using Average True Range price movement – or volatility – as described in Michael Gur’s book The Symmetry Wave Trading Method.
For the swing to change direction the price must retrace from a high or low by 4 ATRs. Chart 1 shows the Volatility Swing overlaid on the S&P500 is the first lower swing down after 7 higher highs and lows. The current swing low was on March 13th, and it will only turn higher if price moves 4 x ATR(14) to 5897. However, that value will change depending on the future daily volatility (if the ATR increases then a larger move will be required).
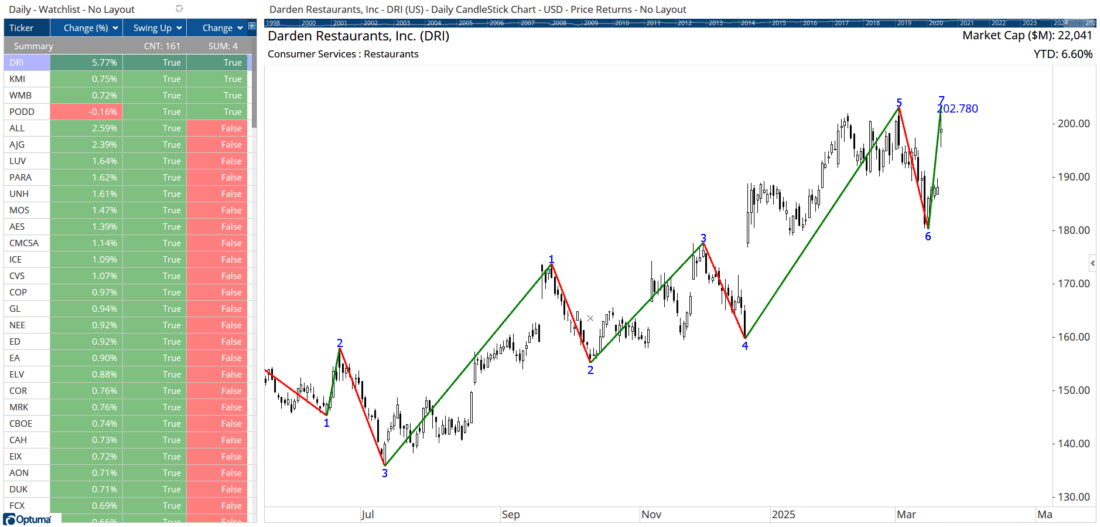
A quick Volatility Swing scan on the S&P500 shows that 161 members have an upward swing with four changing direction on Thursday, including Darden Restaurants $DRI which confirmed its 7th higher swing.
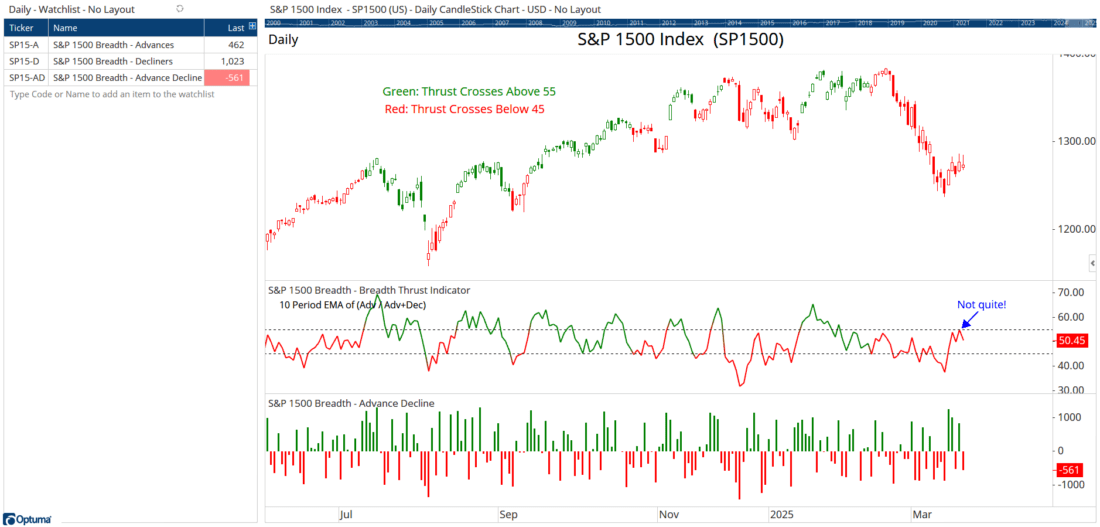
Here’s an update to the S&P1500 Breadth Thrust chart from earlier in the week. Despite strong advancing numbers recently, there was a net decline of -561 on Thursday, meaning the 10 day Thrust measure just failed to cross the threshold of 55.
—
Originally posted 21st March
Investopedia.com: The comments, opinions and analyses expressed herein are for informational purposes only and should not be considered individual investment advice or recommendations to invest in any security or to adopt any investment strategy. While we believe the information provided herein is reliable, we do not warrant its accuracy or completeness. The views and strategies described on our content may not be suitable for all investors. Because market and economic conditions are subject to rapid change, all comments, opinions and analyses contained within our content are rendered as of the date of the posting and may change without notice. The material is not intended as a complete analysis of every material fact regarding any country, region, market, industry, investment or strategy. This information is intended for US residents only.
Information posted on IBKR Campus that is provided by third-parties does NOT constitute a recommendation that you should contract for the services of that third party. Third-party participants who contribute to IBKR Campus are independent of Interactive Brokers and Interactive Brokers does not make any representations or warranties concerning the services offered, their past or future performance, or the accuracy of the information provided by the third party. Past performance is no guarantee of future results.
This material is from Investopedia and is being posted with its permission. The views expressed in this material are solely those of the author and/or Investopedia and Interactive Brokers is not endorsing or recommending any investment or trading discussed in the material. This material is not and should not be construed as an offer to buy or sell any security. It should not be construed as research or investment advice or a recommendation to buy, sell or hold any security or commodity. This material does not and is not intended to take into account the particular financial conditions, investment objectives or requirements of individual customers. Before acting on this material, you should consider whether it is suitable for your particular circumstances and, as necessary, seek professional advice.
Related Articles


Join The Conversation
For specific platform feedback and suggestions, please submit it directly to our team using these instructions.
If you have an account-specific question or concern, please reach out to Client Services.
We encourage you to look through our FAQs before posting. Your question may already be covered!