
- Solve real problems with our hands-on interface
- Progress from basic puts and calls to advanced strategies
Interactive Options Course
Posted November 11, 2025 at 9:33 am
1/ Growth Momentum Targets New $110 High After Massive Bounce
2/ VXX: Volatility Set for New All-Time Lows After Massive Decline
3/ Gold Miners Maintain Leadership, Target $82
4/ Ark Innovation Prepares for New Highs
5/ South Korea Drives Global Tech Momentum
Investopedia is partnering with CMT Association on this newsletter. The contents of this newsletter are for informational and educational purposes only, however, and do not constitute investing advice. The guest authors, which may sell research to investors, and may trade or hold positions in securities mentioned herein do not represent the views of CMT Association or Investopedia. Please consult a financial advisor for investment recommendations and services.
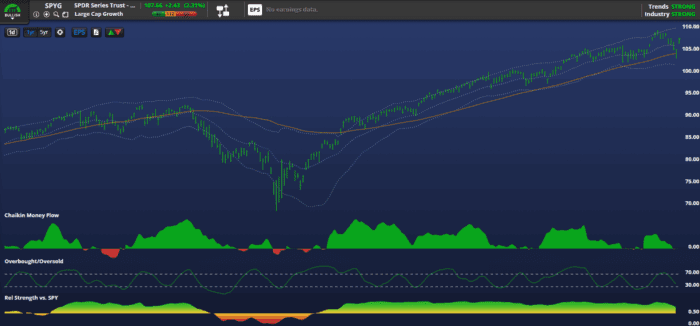
Growth Momentum Targets New $110 High After Massive Bounce

The S&P 500 Growth ETF (SPYG) is back in focus, marking a strong multi-standard deviation move by trading up 2.3% on Monday. This recovery follows a brief, sharp dip from its all-time high of nearly $110 a share on October 29th, to a near-term low of $103 last Friday. The swift appearance of a strong reversal candle at the bottom led to sustained institutional buying at Monday’s open, confirming immediate price support.
Technical indicators overwhelmingly support the ETF’s exceptional strength. The Relative Strength Index (RSI) is holding well above 44, confirming that momentum stabilized quickly after the dip, and the price remains convincingly above a rising 200-day moving average since early May. This persistent performance is further corroborated by exceptional money flow metrics which have been positive since May, allowing SPYG to outperform the core S&P 500 (SPY) throughout the current growth cycle.
While minor consolidation is possible this week, specifically under the 21-day exponential moving average at $106, investors can anticipate a swift absorption of capital, mirroring the rapid snap-backs seen all year. The clear investor appetite confirms that any pullback should be viewed as a prime buying opportunity rather than a point of concern. Given this continued exceptional demand and bullish technical posture, the short-term price target for late November is $110, set to eclipse the previous all-time high.
VXX: Volatility Set for New All-Time Lows After Massive Decline

The iPath S&P 500 VIX Short-Term Futures ETN (VXX) has registered a powerful multiple-standard deviation decline, dropping a sharp 5.6% on Monday. This movement confirms the relentless structural weakness that has plagued the instrument since late June, concurrent with the surging equity market. After falling decisively under its long-term 200-day moving average, VXX printed a new all-time low of nearly $32 a share on October 27th, marking its exceptionally weak posture.
While the VXX is inherently difficult to chart due to the constant roll-over of short-term VIX futures, technical action provides clear near-term boundaries for trading. Following this extreme sell-off, we anticipate a brief, counter-trend rebound over the next few days. However, this recovery is expected to stall and fail decisively at the $35 level, which represents the ceiling of the current short-term bear cycle. For historical reference, VXX’s volatility peaked earlier this year, spiking to $91 during the April tariff crisis.
Aside from the brief equity market scare between October 10th and 20th, VXX remains a poor vehicle for capital allocation. Prior periods of oversold readings in July, August, and September were quickly absorbed, failing to sustain any meaningful rally. Given the overwhelming bearish momentum and VXX’s persistent inverse correlation with the underlying equity market, we expect the instrument to print new all-time lows. The firm downside target is $31 by the end of November, confirming the path of least resistance is firmly down.
Gold Miners Maintain Leadership, Target $82

The VanEck Gold Miners ETF (GDX) has demonstrated significant technical strength, evidenced by a powerful +7% performance over the last five trading days. This recent move involved bouncing decisively off its short-term support bottom near $68, confirming the commitment of institutional buyers. GDX remains an absolute market leader, having rallied 94% over the past twelve months. Historically, entries positioned at the 21-day moving average, currently near the $73 level, have been promptly rewarded, making this zone critical for accumulation.
The long-term bullish structure of GDX remains firmly intact. Crucially, the instrument has not closed below its essential rising 200-day moving average since mid-January, which underscores the robust strength of its primary uptrend. Furthermore, the Relative Strength Index (RSI) recently bottomed at the 40 level. This reading mirrors the technical setup seen during the powerful April advance, confirming that the current move is consolidating healthily and is not indicative of a structural breakdown.
GDX recently celebrated a superb, sustained overbought period from late August through early October, successfully driving the price from $61 up to $79. While the 52-week high was struck at $85 on October 16th, the current momentum and technical floor suggest a clear continuation of the upward trajectory. The near-term price target for the end of November is set at $82, and consistent with its position as a market leader, all pullbacks in price should be viewed as sustained buying opportunities.
Ark Innovation Prepares for New Highs
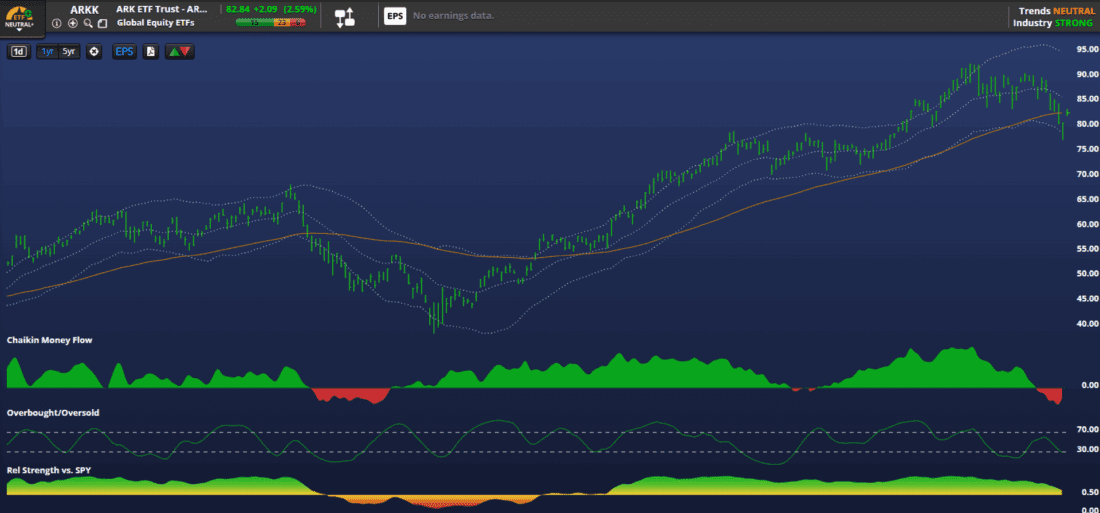
The ARK Innovation ETF (ARKK) stands out as a formidable year-over-year leader, boasting impressive 55% gains that confirm its long-term bullish momentum. This period of strength has, however, encountered some recent weakness down 6% over the past 5 days, with the ETF slipping just under the 50 mark on its Relative Strength Index (RSI). This technical dip is unusual for ARKK, requiring historical reference back to April, when the fund was last emerging from its 52-week lows, to find a similar instance of consolidation.
Despite this recent consolidation, the fund is supported by a robust, rising 200-day moving average, which has served as a technical floor. Notably, this average held firm even when ARKK traded in a sideways, corrective phase beneath it from mid-March through mid-May. ARKK, led by Cathie Wood, has previously demonstrated the ability to sustain momentum, experiencing robust overbought environments during June, July, September, and October.
While the potential for further near-term basing remains for the rest of this week, the attractive risk/reward profile suggests accumulation under $86 is warranted. The solid technical floor for committed buyers appears to be near the $79 mark. With the previous yearly high struck on October 8th near $93, the clear directional target for early December is a return to, and eventual breakout of, those new high levels.
South Korea Drives Global Tech Momentum
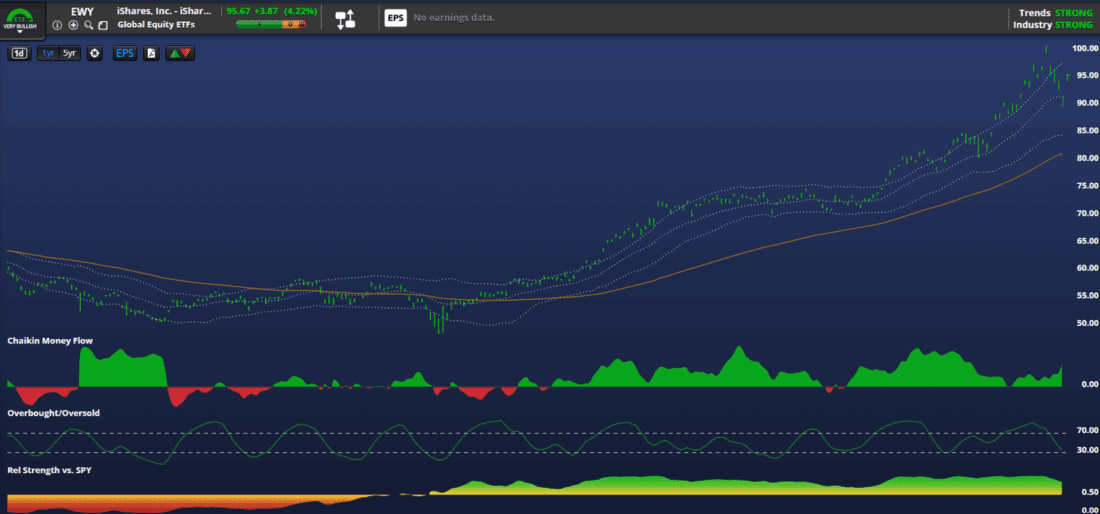
The iShares MSCI South Korea ETF (EWY) has cemented its status as a global technology leader, delivering a remarkable 61% year-over-year gain, including a strong 4.2% advance on Monday. This impressive run is built on a solid technical foundation that began when the ETF hit its 52-week low near $48 on April 8th. Although its 200-day moving average was initially sliding, EWY managed its first decisive close above this major trend line on May 14th, confirming the new long-term uptrend.
This structural shift gained considerable momentum in early June when the fund registered an overbought signal on its Relative Strength Index (RSI), providing the catalyst needed to accelerate the 200-day moving average’s incline. This energy carried the price to $72 by the end of June before the ETF entered a necessary consolidation phase, trading range-bound between $70 and $75 until early September. The defining price explosion occurred following a subsequent overbought registration in mid-September, rocketing the stock from $78 to new all-time highs of nearly $101 last week.
This aggressive, sustained movement is highly unusual for a geographical ETF, yet it is explained by EWY’s composition: it is largely a technology play, with Samsung Electronics comprising a massive 23% of the fund. Technical momentum indicators remain robust, with the RSI holding firmly above 43 since the April low. Traders are advised to look for entry points under $92 to establish long positions, targeting a return to $101 or new all-time highs for December, offering a compelling way to gain exposure to the global bull market beyond the Mag 7 tech stocks.
—
Originally posted 11th November 2025
Investopedia.com: The comments, opinions and analyses expressed herein are for informational purposes only and should not be considered individual investment advice or recommendations to invest in any security or to adopt any investment strategy. While we believe the information provided herein is reliable, we do not warrant its accuracy or completeness. The views and strategies described on our content may not be suitable for all investors. Because market and economic conditions are subject to rapid change, all comments, opinions and analyses contained within our content are rendered as of the date of the posting and may change without notice. The material is not intended as a complete analysis of every material fact regarding any country, region, market, industry, investment or strategy. This information is intended for US residents only.
Information posted on IBKR Campus that is provided by third-parties does NOT constitute a recommendation that you should contract for the services of that third party. Third-party participants who contribute to IBKR Campus are independent of Interactive Brokers and Interactive Brokers does not make any representations or warranties concerning the services offered, their past or future performance, or the accuracy of the information provided by the third party. Past performance is no guarantee of future results.
This material is from Investopedia and is being posted with its permission. The views expressed in this material are solely those of the author and/or Investopedia and Interactive Brokers is not endorsing or recommending any investment or trading discussed in the material. This material is not and should not be construed as an offer to buy or sell any security. It should not be construed as research or investment advice or a recommendation to buy, sell or hold any security or commodity. This material does not and is not intended to take into account the particular financial conditions, investment objectives or requirements of individual customers. Before acting on this material, you should consider whether it is suitable for your particular circumstances and, as necessary, seek professional advice.
Any discussion or mention of an ETF is not to be construed as recommendation, promotion or solicitation. All investors should review and consider associated investment risks, charges and expenses of the investment company or fund prior to investing. Before acting on this material, you should consider whether it is suitable for your particular circumstances and, as necessary, seek professional advice.
Futures are not suitable for all investors. The amount you may lose may be greater than your initial investment. Before trading futures, please read the CFTC Risk Disclosure. A copy and additional information are available at ibkr.com.
Related Articles


Join The Conversation
For specific platform feedback and suggestions, please submit it directly to our team using these instructions.
If you have an account-specific question or concern, please reach out to Client Services.
We encourage you to look through our FAQs before posting. Your question may already be covered!