
- Solve real problems with our hands-on interface
- Progress from basic puts and calls to advanced strategies
Interactive Options Course
Posted October 28, 2024 at 11:50 am
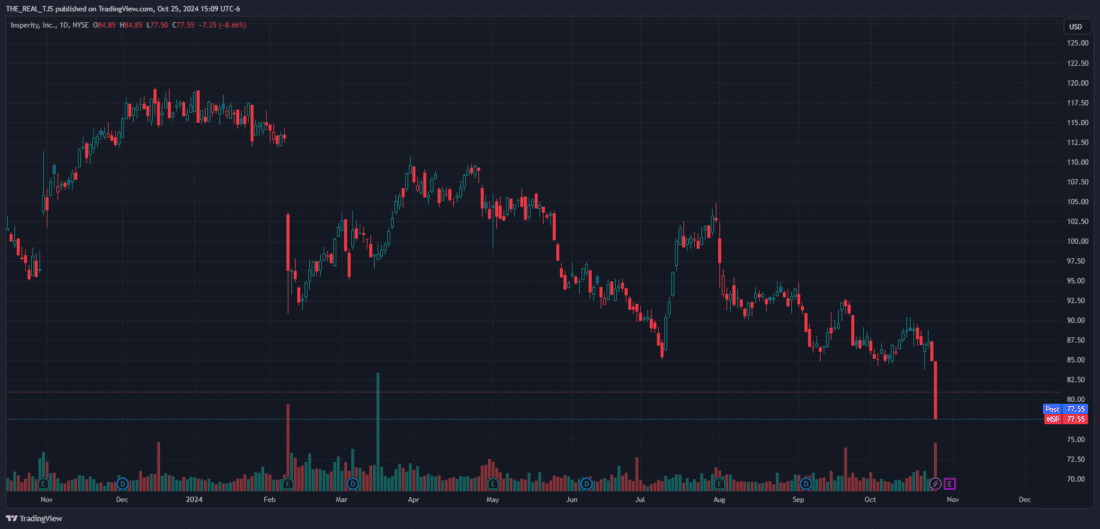
2/ $BILL
Investopedia is partnering with CMT Association on this newsletter. The contents of this newsletter are for informational and educational purposes only, however, and do not constitute investing advice. The guest authors, which may sell research to investors, and may trade or hold positions in securities mentioned herein do not represent the views of CMT Association or Investopedia. Please consult a financial advisor for investment recommendations and services.
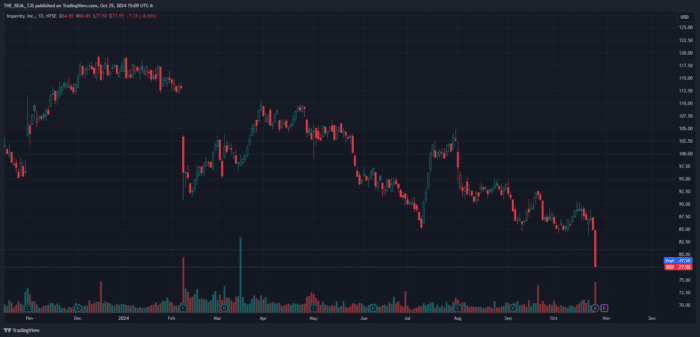
$NSP
In my previous post, I highlighted how artificial intelligence is being put to use in the world of technical analysis. Another discipline that marries well with technical analysis is statistics. In fact, when it comes to trading I would refer to myself as a quantitative technical analyst. Part of the bad rap technicals get is that they wouldn’t hold up in a more scientific sense. Those that aren’t well versed in technical analysis see it as a voodoo art akin to astrology or palm reading. Depending upon what aspect of TA they are talking about, I tend to agree. If you are a portfolio manager trying to raise capital in a room full of wealthy individuals and you mention your strategy centers around Gann Fans, moving average crossovers, overbought and oversold indicators, and Fibonacci Levels, you’re going to have a tough time. But what if you had statistics on your side such as win / loss ratios, profit and loss figures, and statistical significance of multiple strategies on your side? That might carry more weight.
Luckily we have tools at our disposal like TradeMachine (another CML Pro Product) on our side. And once again, I am in no way compensated for any one who signs up for a subscription. I pay for these products out of my own pocket and get no discounts, commissions, or praise for mentioning them. I am just showing you tools I use personally to assist in my trading.
Being from Omaha, Nebraska it may come as no surprise that I am a value guy at heart. When investing, I look for quality companies to buy when the overall market is weak, or they had a rough quarter or two. When I am trading, I am looking for stocks temporarily beaten up, ripe for a reversal in the near term. Yep, I trade against the trend. A big “no no” but I have a specific set of criterion for doing so, and part of that criterion is statistics.
Technicians often throw around words like “overbought” and “oversold” but these need to be defined if you want to approach it from a scientific or mathematical sense. A familiar one to many is the general overbought and oversold readings on the RSI indicator. First define your time frame. What is overbought on one time frame can be oversold on another so time frame is important. Then, define the OB/OS readings of the indicator you are using. For RSI many use the standard 70/30 levels. Those are just fine as long as you define them. Finally, it isn’t enough to say something is overbought or oversold. So what? Things can stay overbought and oversold. But if you can define your timeframe, your levels, and then ask the question, “The last X number of times this was oversold what happened to price in the next X number of days and to what extent?” you are working your way into quantitative technical analysis. Here is an example:
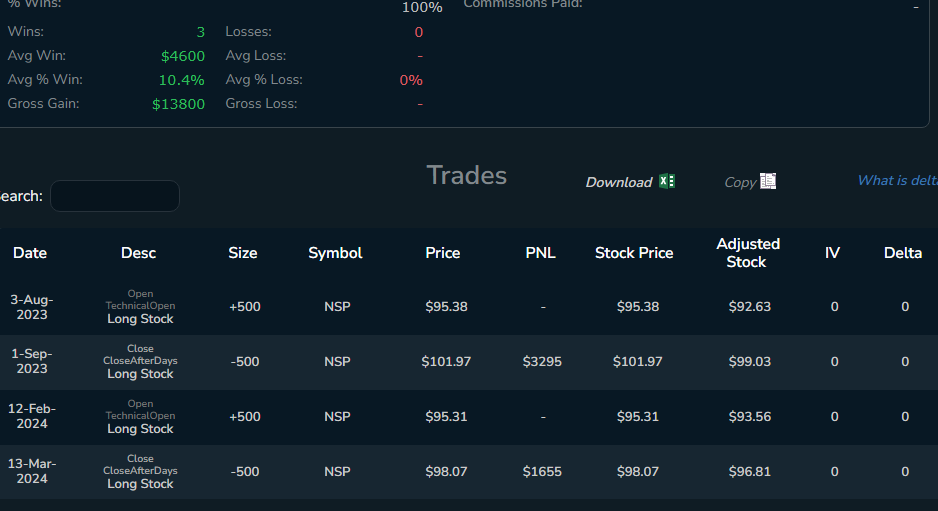
$NSP is a stock that seems to be more than beaten up. So let’s see what statistics says if we set up some parameters. I am using this as an example just because I’ve done this long enough to know that an RSI under 25 often is ripe for a near term reversal. So RSI is defined as a stock under RSI 25, and I’ll pick a holding period of 22 days. Next I’ll pick a lookback period to see how many times this stock in the last 3 years has had this signal trigger. In the past three years this has happened 3 times and the win rate is 3 wins to 0 losses for an average gain of just over 10% over a 22 day holding period. Take caution for those names (like this one) that has earnings coming up. But as you can see, you can get creative in terms of indicators you want to test based on defined criterion and holding periods. TradeMachine does the number crunching for you and will give you statistics for win/loss rate, signal strength and profit and loss based on money risked on the trade.
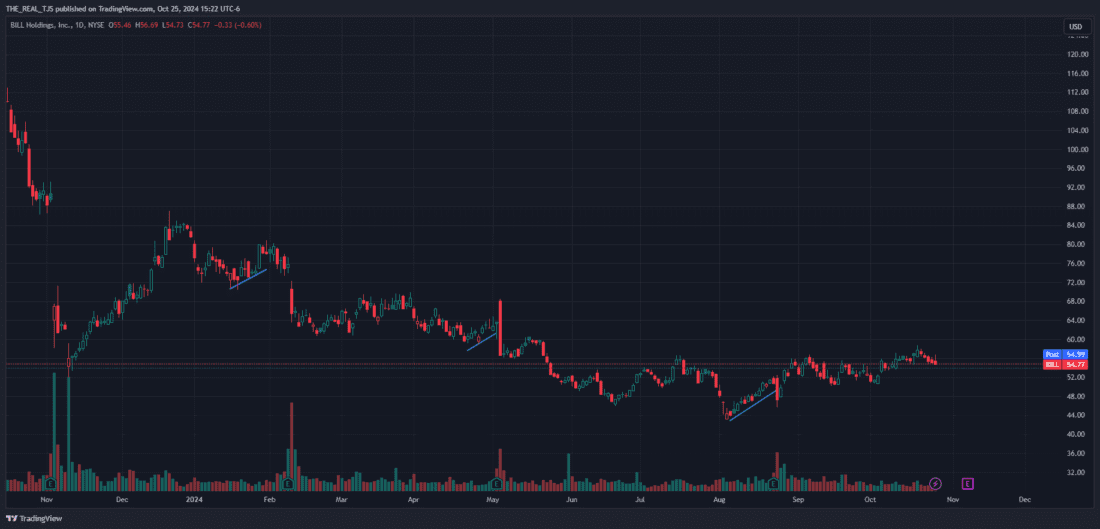
$BILL
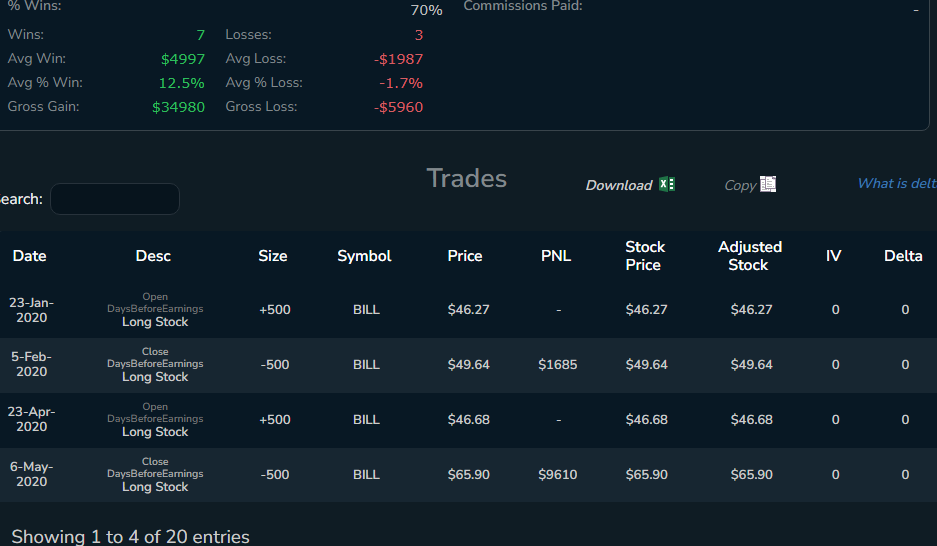
Another favorite strategy of mine is looking for stocks that have earnings coming up in the next one or two weeks. Especially if they are stocks with greater short interest than average. Funds with short positions will often cover short positions going into earnings to lock in profits before the quarterly release. If they don’t the risk losing their gains on a binary earnings event (Hello Tesla shorts). For this example, we won’t use a technical signal but rather just look for momentum into earnings. A recent signal for earnings momentum was that of stock symbol $BILL. From a chart we can see that it seems to trade well going into earnings. What happens on earnings doesn’t concern us because we will exit the trade before the release. So we have our defined event and time frame of pre earnings momentum in the 14 days leading up to the report. How has the stock faired in the past X number of defined years from a win / loss standpoint and percentage profit and loss? The last 10 earnings reports the stock has profited 7 times, and lost money 3 times complete with percentage gains when the signal wins and losses when it doesn’t work.
The marrying of basic technical analysis with a quantitative component adds weight to the “voodoo” part of what we as technicians do. The TradeMachine platform is extremely customizable and you can back test signals for almost any idea you have in mind. I just chose a couple of the basic ones I have used over the years but you can get as creative as you want. This is just one more tool you can take advantage of in your trading.
—
Originally posted 28th October 2024
Investopedia.com: The comments, opinions and analyses expressed herein are for informational purposes only and should not be considered individual investment advice or recommendations to invest in any security or to adopt any investment strategy. While we believe the information provided herein is reliable, we do not warrant its accuracy or completeness. The views and strategies described on our content may not be suitable for all investors. Because market and economic conditions are subject to rapid change, all comments, opinions and analyses contained within our content are rendered as of the date of the posting and may change without notice. The material is not intended as a complete analysis of every material fact regarding any country, region, market, industry, investment or strategy. This information is intended for US residents only.
Information posted on IBKR Campus that is provided by third-parties does NOT constitute a recommendation that you should contract for the services of that third party. Third-party participants who contribute to IBKR Campus are independent of Interactive Brokers and Interactive Brokers does not make any representations or warranties concerning the services offered, their past or future performance, or the accuracy of the information provided by the third party. Past performance is no guarantee of future results.
This material is from Investopedia and is being posted with its permission. The views expressed in this material are solely those of the author and/or Investopedia and Interactive Brokers is not endorsing or recommending any investment or trading discussed in the material. This material is not and should not be construed as an offer to buy or sell any security. It should not be construed as research or investment advice or a recommendation to buy, sell or hold any security or commodity. This material does not and is not intended to take into account the particular financial conditions, investment objectives or requirements of individual customers. Before acting on this material, you should consider whether it is suitable for your particular circumstances and, as necessary, seek professional advice.
Related Articles
 for Daily Seasonal Data")


Join The Conversation
For specific platform feedback and suggestions, please submit it directly to our team using these instructions.
If you have an account-specific question or concern, please reach out to Client Services.
We encourage you to look through our FAQs before posting. Your question may already be covered!