
- Solve real problems with our hands-on interface
- Progress from basic puts and calls to advanced strategies
Interactive Options Course

Posted December 17, 2025 at 9:53 am
1/ Precious Metals: Naughty or Nice?
2/ Gold
3/ Silver
4/ Platinum
5/ Palladium
Investopedia is partnering with CMT Association on this newsletter. The contents of this newsletter are for informational and educational purposes only, however, and do not constitute investing advice. The guest authors, which may sell research to investors, and may trade or hold positions in securities mentioned herein do not represent the views of CMT Association or Investopedia. Please consult a financial advisor for investment recommendations and services.
Precious Metals: Naughty or Nice?
This week, I am doing my best impression of Santa Claus by reviewing various energy, metals, and perhaps a few equity charts to decide if they will be put on the naughty or nice list. I am sure that Jolly Old Saint Nicholas has his elves put all children on the nice list, at least initially. Therefore, we will do the same for the markets we review. However, should those markets display some bad behavior, then we will all know when to move them to the naughty list as their trends weaken or change.
Last night I watched “Rudolph the Red-Nosed Reindeer” with my daughters and have had the Burl Ives “Silver and Gold” song stuck in my head all day. I took this as a sign. Therefore, today, we will check the list of precious metals.
Gold
Gold is looking bullish again after breaking higher out of a symmetrical triangle a few weeks ago. Prices briefly pulled back to test and hold the upper trendline of the triangle pattern before breaking higher again late last week. The $4385 equal to (1.00) target of the primary wave up from $3933.2 (dark red) was tested and held last Friday. This is a key objective, because settling above $4385 will open the way for a move above the $4433 high to challenge the $4439 XC (2.764) projection of the wave up from $4032.8 (orange) and the equal to target of the wave up from $4054.2 (purple). Settling above $4398 will confirm that the corrective pullback from $4433 is complete and that gold will remain on the ‘nice list’ for at least another few weeks, opening the way for $4527 and higher.
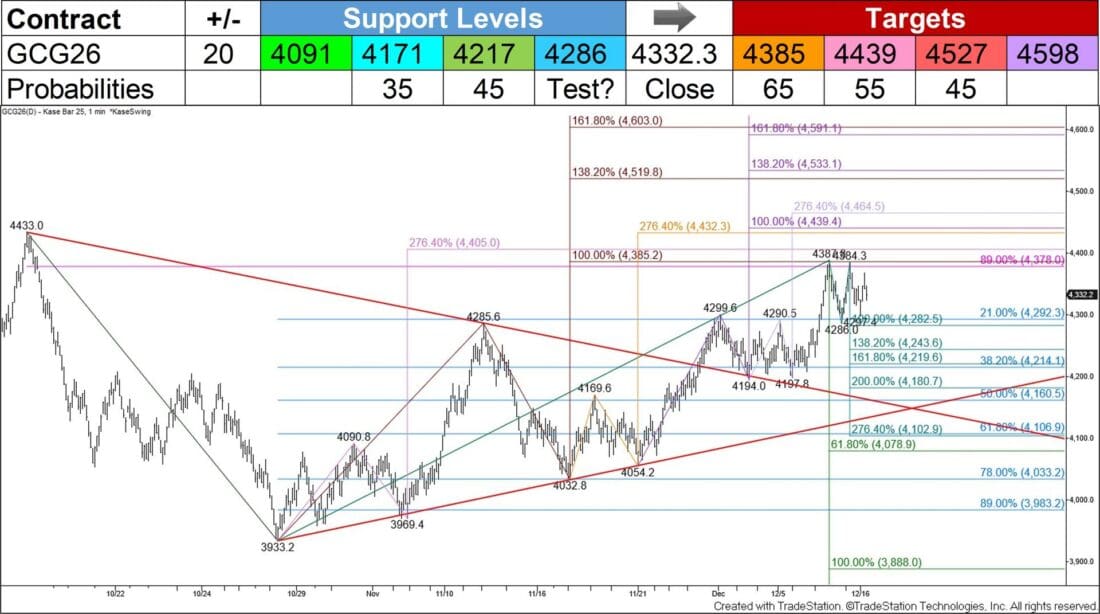
Nevertheless, gold is thinking about being ‘naughty’, and we are going to have to keep a close eye on it throughout the holiday season. This is because after rising to $4387.8 and holding $4385 on a closing basis, an intraday double top around $4385 has formed. Friday and Monday’s shooting stars and Tuesday’s long-legged doji warn that a correction might occur before settling above $4385. The daily RSI is nearly overbought, and daily bearish KaseCD and MACD divergences were confirmed on Tuesday.
The small wave down from $4387.8 (dark cyan) has held its $4321 smaller than (0.618) target on a closing basis, and the bearish patterns have not been confirmed. Therefore, the outlook still leans bullish for the coming weeks. Nevertheless, should gold close below the $4384 equal to target of this wave, the double top will be confirmed. This would not mean that gold is getting a lump of coal in its stocking, but it is definitely not getting a new bicycle. In this case, look for a deeper correction to challenge $4217 and possibly $4161 target of the double top, which is in line with the $4171 support level. This is an area of support that is expected to hold. Settling below $4171 for a few days would suggest that a more significant reversal is underway, where $4091 is key. This is the 62 percent retracement of the rise from $3933.2 (light blue) and the smaller than target of the wave down from $4433 (green). Settling below $4091 would open the way for an eventual test of this wave’s $3888 equal to target.
Silver
Silver has been really nice this year and has continued to reward bulls in recent weeks. The March futures contract is poised to reach the $70.85 equal to target of the primary wave up from $29.620 (red) in the coming weeks. The connection to $70.85 is made through the $67.97 XC projection of the first wave up from $29.620 (purple) and the equal to target of the wave up from $48.710.
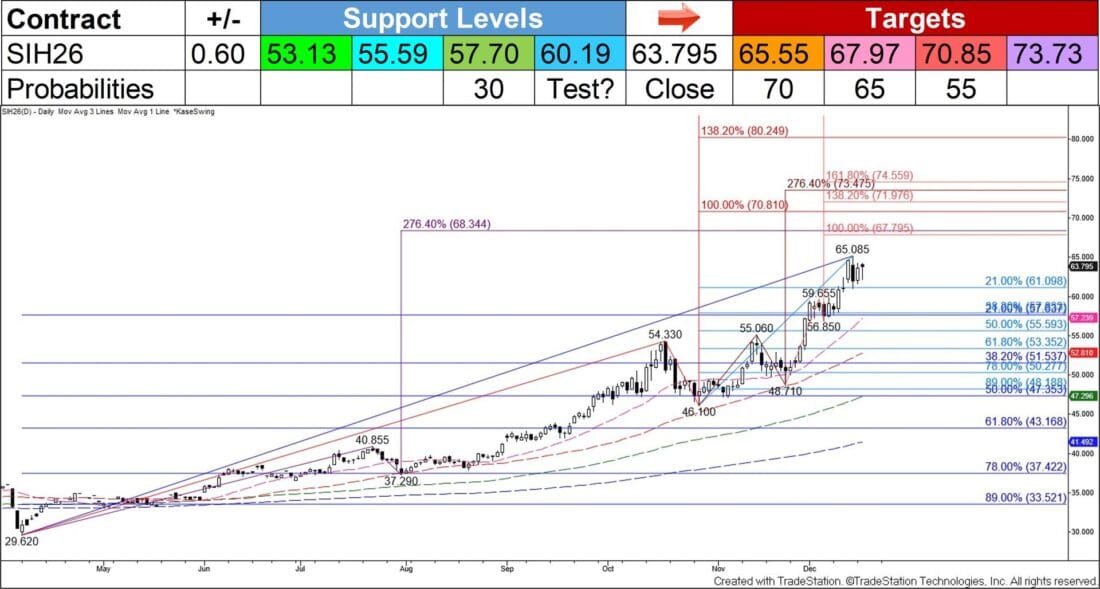
Nonetheless, silver has been so nice in recent weeks that it is having a few last-minute thoughts about possibly being a little naughty before the end of the year. Daily bearish KaseCD and KasePO divergences were confirmed on Tuesday, and the daily RSI and Stochastic are overbought. I don’t think silver will fall far enough to be put on the naughty list by settling below support at $57.70. However, it may sneak an extra helping of dessert and test $60.19 before rising and closing above $65.55, which would clear the way for $67.97 and eventually $70.85.
Platinum
Platinum is really doing some last-minute work to ensure that it will stay on the ‘nice list’ through the holidays and into the new year. The January contract rose to fulfill the $1890 equal to target of the primary wave up from $900.4 (red) on Tuesday. A sustained close above $1890 will call for a highly confluent $1988 target and eventually the next major objective at the $2125 intermediate (1.382) target of the wave up from $900.4.

The $1890 target is a potential stalling point, and the daily KasePO, RSI, and Stochastic momentum oscillators are overbought. Platinum may be tempted to take an extra helping of dessert with silver, but it has been so good in recent weeks that it would have to settle below the 62 percent retracement of the rise from $1481.2 (light blue) and the 20- and 50-day moving averages around $1637 to be put on the ‘naughty list’.
Palladium
Palladium has poured on the charm for the past few days and is making sure to keep its room clean during the holiday season. The March contract settled above the equal to target of the wave up from $1366.5 (dark red) and is poised to reach a new high of $1730. This is the intermediate target of the wave up from $1366.5 and the smaller than target of the wave up from $1101.0 (purple). Just above this at $1768 is the larger than target of the wave up from $1366.5 and the intermediate target of the wave up from $910.0 (red). Closing above these objectives will clear the way for an eventual test of the $1879 larger than target of the wave up from $910 and possibly the $1985 equal to target of the wave up from $1101.

The daily RSI is overbought and the 89 percent retracement of the decline from $1703.5 (magenta) held on Tuesday. However, there are no bearish patterns or confirmed signals that call for the move up to stall. Therefore, even if palladium stumbles a bit, a move down will likely be a correction and is expected to hold the 38 percent retracement of the rise from $1366.5 (light blue) at $1552. Key support and palladium’s ‘naughty list’ threshold is the 62 percent retracement and the smaller than target of the wave down from $1703.5 (green) at $1476. Settling below this would call for $1399, and eventually this wave’s $1335 equal to target.
—
Originally posted 17th December 2025
Investopedia.com: The comments, opinions and analyses expressed herein are for informational purposes only and should not be considered individual investment advice or recommendations to invest in any security or to adopt any investment strategy. While we believe the information provided herein is reliable, we do not warrant its accuracy or completeness. The views and strategies described on our content may not be suitable for all investors. Because market and economic conditions are subject to rapid change, all comments, opinions and analyses contained within our content are rendered as of the date of the posting and may change without notice. The material is not intended as a complete analysis of every material fact regarding any country, region, market, industry, investment or strategy. This information is intended for US residents only.
Information posted on IBKR Campus that is provided by third-parties does NOT constitute a recommendation that you should contract for the services of that third party. Third-party participants who contribute to IBKR Campus are independent of Interactive Brokers and Interactive Brokers does not make any representations or warranties concerning the services offered, their past or future performance, or the accuracy of the information provided by the third party. Past performance is no guarantee of future results.
This material is from Investopedia and is being posted with its permission. The views expressed in this material are solely those of the author and/or Investopedia and Interactive Brokers is not endorsing or recommending any investment or trading discussed in the material. This material is not and should not be construed as an offer to buy or sell any security. It should not be construed as research or investment advice or a recommendation to buy, sell or hold any security or commodity. This material does not and is not intended to take into account the particular financial conditions, investment objectives or requirements of individual customers. Before acting on this material, you should consider whether it is suitable for your particular circumstances and, as necessary, seek professional advice.
Futures are not suitable for all investors. The amount you may lose may be greater than your initial investment. Before trading futures, please read the CFTC Risk Disclosure. A copy and additional information are available at ibkr.com.
Related Articles


Join The Conversation
For specific platform feedback and suggestions, please submit it directly to our team using these instructions.
If you have an account-specific question or concern, please reach out to Client Services.
We encourage you to look through our FAQs before posting. Your question may already be covered!