
- Solve real problems with our hands-on interface
- Progress from basic puts and calls to advanced strategies
Interactive Options Course
Posted December 15, 2025 at 9:25 am
1/ Natural Gas: Naughty or Nice?
2/ January Natural Gas Daily Charts
3/ January Natural Gas $0.03 Kase Bar Chart
4/ Weekly Natural Gas Continuation Chart
5/ Natural Gas ‘Naughty’ Scenario
Investopedia is partnering with CMT Association on this newsletter. The contents of this newsletter are for informational and educational purposes only, however, and do not constitute investing advice. The guest authors, which may sell research to investors, and may trade or hold positions in securities mentioned herein do not represent the views of CMT Association or Investopedia. Please consult a financial advisor for investment recommendations and services.
Natural Gas: Naughty or Nice?
It is that time of year when Jolly Old Saint Nicholas has made his list and is checking it twice. You better believe, he is going to know who has been naughty and who has been nice.
As traders and market analysts, it is not always easy to determine when a market is going to treat you nicely or when it will decide to be naughty. Although I have the beard, my hair is getting whiter, and my belly a little bigger with each passing year, I am not as wise and all-knowing as Santa Claus. Nevertheless, over the next week, I will channel my inner holiday spirit and, with the help of a few technical analysis tools and techniques, will examine various commodities and possibly a few equities to determine whether those markets will remain ‘nice’ or close beyond levels that would shift the outlook to ‘naughty’ as we head into the new year.
Natural gas is first on our list.
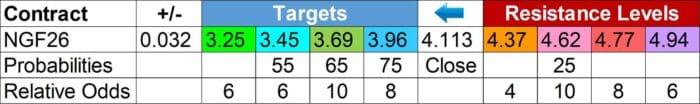
The prompt month January 2026 natural gas contract failed to extend the trend up from $3.913 and overcome an important $5.38 target again. Instead, prices gapped down on Monday and confirmed daily bearish momentum oscillator divergences and daily and weekly overbought signals. Prices fell aggressively for the remainder of the week. The bullish trendline up from $3.913 was broken, the last major swing low at $4.390 was taken out, and January settled the week below a bearish decision point at $4.21. The trend is now bearish, and a ‘nice’ market will challenge at least $3.96 early in the week. Settling below this will call for tests of the next major targets at $3.69 and $3.45 within the next few weeks.

Nevertheless, support at $4.07 held on a closing basis on Friday, and the decline from $5.496 lacks a clear primary wave that will help to drive prices lower. A correction is due, and the daily Stochastic is oversold. Even so, the Stochastic can remain oversold for an extended period, and there are no other bullish patterns or signals. Volatility is high, so a correction could quickly challenge resistance at $4.37. Settling above this would call for a test of the ‘naughty’ resistance level at $4.62. Closing above $4.62 would not indicate that the move down is complete, but this would suggest that prices overextended to the downside and call for natural gas to move into its ‘naughty’ scenario, where a more substantial test of resistance and possibly a period of consolidation would occur.
Below are some of the recent technical factors used to determine the ‘naughty’ or ‘nice’ outlook for the next few weeks.
Nice (Bearish)
Naughty (Bullish)
January Natural Gas Daily Charts
Natural gas quickly adopted a bearish outlook during the past week. The trend up from $3.913 failed to recapture and close above the $5.38 equal to (1.00) target of the prior primary wave up from $3.913 (invalidated) and the $5.43 XC (2.764) projection of the first wave up from $3.913 (purple). Instead, a bearish breakaway gap formed when the market opened late Sunday for Monday’s session. Daily bearish KasePO, KaseCD, Stochastic, and MACD divergences and daily RSI and Stochastic overbought signals were also confirmed on Monday. These signals reflected that the move up was exhausted and indicated that a reversal might occur. Ultimately, a weekly Stochastic overbought signal was also confirmed.
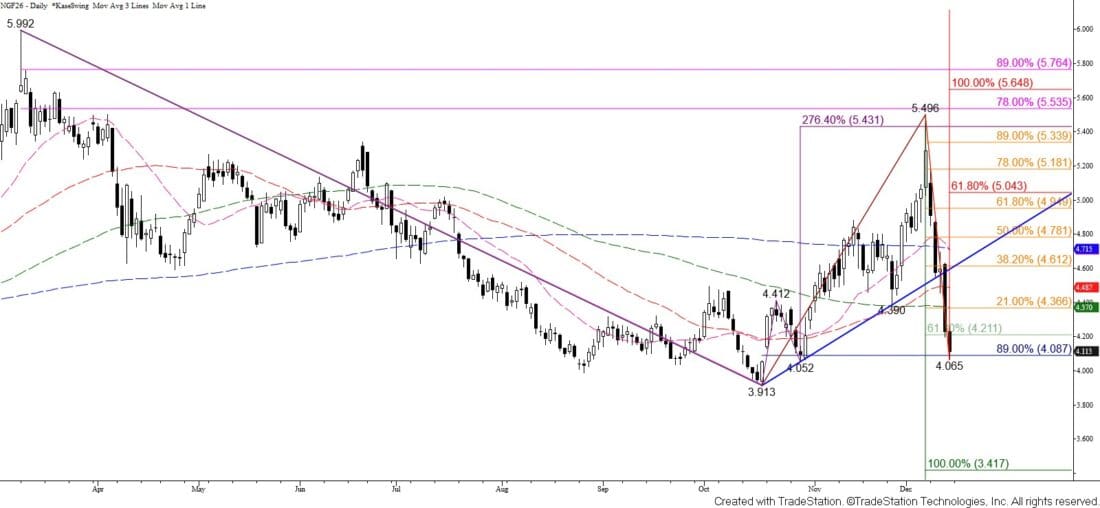
The move down paused near major support at $5.51 and the bullish trendline up from $3.913 (dark blue) on Wednesday, when a long-legged doji formed. The pause was short-lived, though. The move down accelerated again on Thursday, settling below the trendline, $3.51 support, the 50- and 100-day moving averages, and the $4.390 swing low. All of this confirmed that the uptrend had been broken. Friday’s close below the $4.21 smaller than (0.618) target of the new primary wave down from $5.992 (green) indicates that a downtrend is underway. This is because most waves that close beyond their smaller than target extend to at least the equal to target, in this case, $3.45.
January Natural Gas $0.03 Kase Bar Chart
The outlook is firmly bearish heading into the new week. The biggest challenge for the move down from $5.496 is that it lacks a clear primary wave. Currently, the corrective leg $4.455 – $4.696 of the largest wave down from $5.496, was only a 21 percent retracement. Typically, the corrective leg of a primary wave will have at least a 38 percent retracement.

Even so, the current wave down from $5.496 (dark cyan) projects to $4.07 as the smaller than target. This is also the 89 percent retracement of the rise from $3.913 (dark blue), and is a level that was held by Friday’s $4.065 low. This is a potential stalling point, but a close below $4.07 is expected. This will open the way for a test of $3.96 and then the $3.69 equal to target of the wave down from $5.496 in the ‘nice’ scenario. Settling below $3.69 will clear the way for the $3.45 equal to target of the primary wave down from $5.992 to be fulfilled. Because a correction is due, falling to $3.45 might take another few weeks. Also, given the importance of the $3.45 target, sustaining a close below this objective will probably be a challenge.
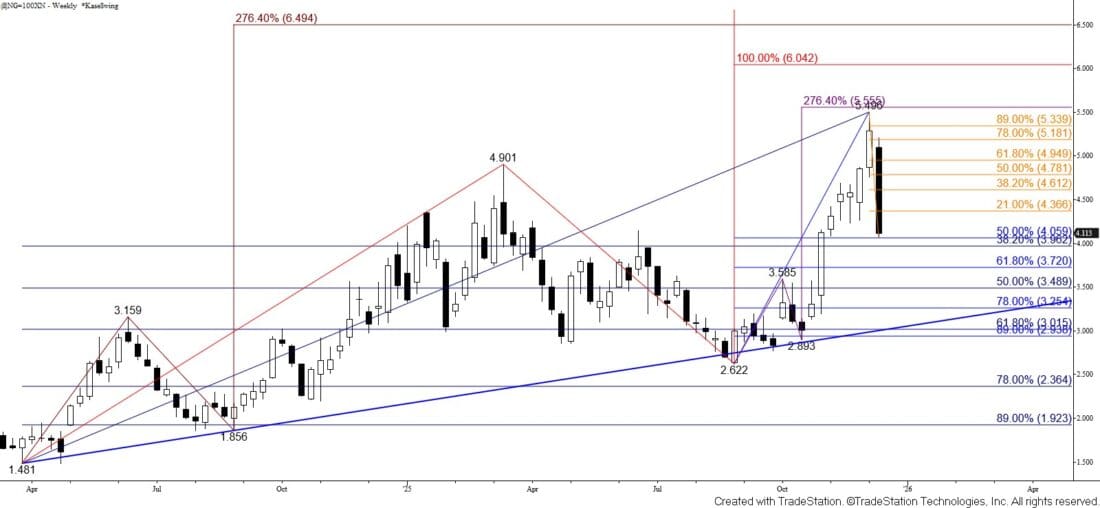
Weekly Natural Gas Continuation Chart
Given the decline that occurred during the past week, most of the forward curve is bearish. However, the uptrend on the weekly continuation chart (rolling first nearby) is intact. To break the continuation charts’ uptrend, natural gas must eventually sustain a close below the trendline up from $1.481 (blue) and take out the $2.622 swing low.
The targets for the January contract align with retracement levels up from $1.481 (dark blue) and $2.622 (blue) on the continuation chart. The $3.96 target, which sits just below the psychologically important $4.00 level, is the 38 percent retracement from $1.481. The $3.69 target is the 62 percent retracement from $2.622, the crucial $3.45 target is the 50 percent retracement from $1.481, and the $3.25 objective is the 78 percent retracement from $2.622. Therefore, even upon a decline to $3.45 within the next few weeks, as expected, the long-term uptrend on the continuation chart will remain intact.
Natural Gas ‘Naughty’ Scenario
As stated, the move down is due for a correction soon. Holding $4.07 support, the lack of a clear primary wave down from $5.496, and an oversold daily Stochastic warn that a correction might occur early in the week. Volatility is high, so the correction could be significant. Initial resistance is the 21 percent retracement from $5.496 (orange) and the 100-day moving average at $4.37. Settling above this would call for a test of key resistance and the 38 percent retracement at $4.62. A normal correction within the ‘nice’ scenario will hold $4.62. Closing above $4.62 would not mean that the move down has ended, but this would put natural gas into its ‘naughty’ scenario and call for a more substantial test of resistance where the next major threshold is the 62 percent retracement at $4.94. Settling above $4.94 would reflect a major shift in bullish sentiment and imply that the move down is complete. Closing above $5.04, the smaller than target of the new primary wave up from $3.913 (red), would confirm a renewed bullish trend. Such a move is doubtful without a firm and lasting bullish shift in weather or other fundamental factors.
—
Originally posted 15th December 2025
Investopedia.com: The comments, opinions and analyses expressed herein are for informational purposes only and should not be considered individual investment advice or recommendations to invest in any security or to adopt any investment strategy. While we believe the information provided herein is reliable, we do not warrant its accuracy or completeness. The views and strategies described on our content may not be suitable for all investors. Because market and economic conditions are subject to rapid change, all comments, opinions and analyses contained within our content are rendered as of the date of the posting and may change without notice. The material is not intended as a complete analysis of every material fact regarding any country, region, market, industry, investment or strategy. This information is intended for US residents only.
Information posted on IBKR Campus that is provided by third-parties does NOT constitute a recommendation that you should contract for the services of that third party. Third-party participants who contribute to IBKR Campus are independent of Interactive Brokers and Interactive Brokers does not make any representations or warranties concerning the services offered, their past or future performance, or the accuracy of the information provided by the third party. Past performance is no guarantee of future results.
This material is from Investopedia and is being posted with its permission. The views expressed in this material are solely those of the author and/or Investopedia and Interactive Brokers is not endorsing or recommending any investment or trading discussed in the material. This material is not and should not be construed as an offer to buy or sell any security. It should not be construed as research or investment advice or a recommendation to buy, sell or hold any security or commodity. This material does not and is not intended to take into account the particular financial conditions, investment objectives or requirements of individual customers. Before acting on this material, you should consider whether it is suitable for your particular circumstances and, as necessary, seek professional advice.
Futures are not suitable for all investors. The amount you may lose may be greater than your initial investment. Before trading futures, please read the CFTC Risk Disclosure. A copy and additional information are available at ibkr.com.
Related Articles


Join The Conversation
For specific platform feedback and suggestions, please submit it directly to our team using these instructions.
If you have an account-specific question or concern, please reach out to Client Services.
We encourage you to look through our FAQs before posting. Your question may already be covered!