
- Solve real problems with our hands-on interface
- Progress from basic puts and calls to advanced strategies
Interactive Options Course
Posted February 18, 2026 at 2:51 am
By Alex Cole
1/ Looking for Higher Highs
2/ Stacking the Evidence
3/ “Go” Trend Appears
Investopedia is partnering with CMT Association on this newsletter. The contents of this newsletter are for informational and educational purposes only, however, and do not constitute investing advice. The guest authors, which may sell research to investors, and may trade or hold positions in securities mentioned herein do not represent the views of CMT Association or Investopedia. Please consult a financial advisor for investment recommendations and services.
Looking for Higher Highs
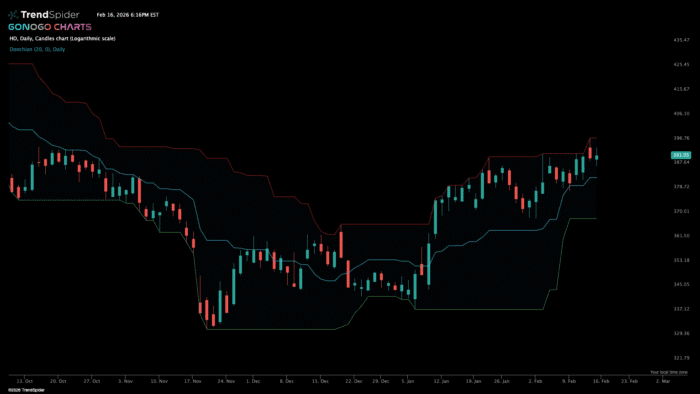
It is the opinion of many that trend identification is perhaps the most important skill we can learn as investors and technical analysts. We like to say that it is simple, but not easy. As we shall see, it is simple in theory to determine trend direction, but definitely not easy to identify these changing trends in real time. However, if we can do just that, we can profit on the majority of the move. Let’s look at the first chart of Home Depot, Inc, (HD).
We are first taught that an uptrend is defined as price making higher highs and higher lows. We can use our eyes for this but to remove subjectivity we can turn to technology to automate the process. An early technical indicator, Donchian Channels, plots an upper line that marks the highest high of a look back period (typically 20) and a lower line that marks the lowest low of the look back period. The green circle highlights the area of the chart where the red line moves higher (price making a higher high).
Stacking the Evidence
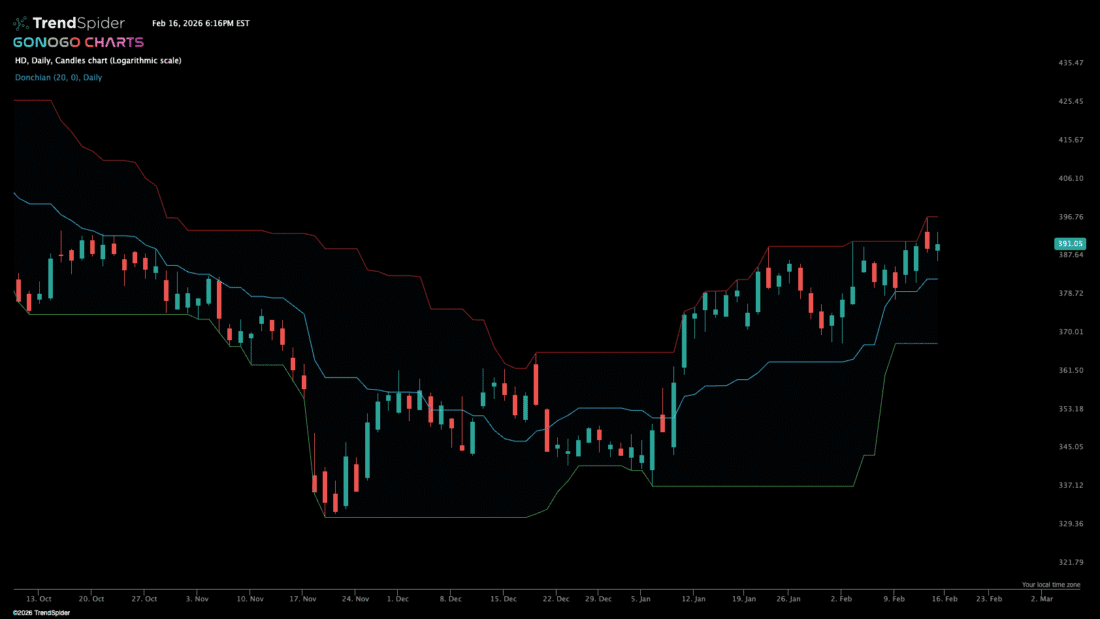
Rather than relying on a single signal, technicians will likely use a weight of the evidence approach. This is a methodology that combines multiple indicators to help understand a market’s probable direction. As each indicator confirms the thesis, the chartist becomes more confident in his analysis. In the first chart, we see the donchian channel moving higher (we have labeled this circled area “1”). In the second chart of Home Depot, Inc, we have added two simple moving averages and bollinger bands.
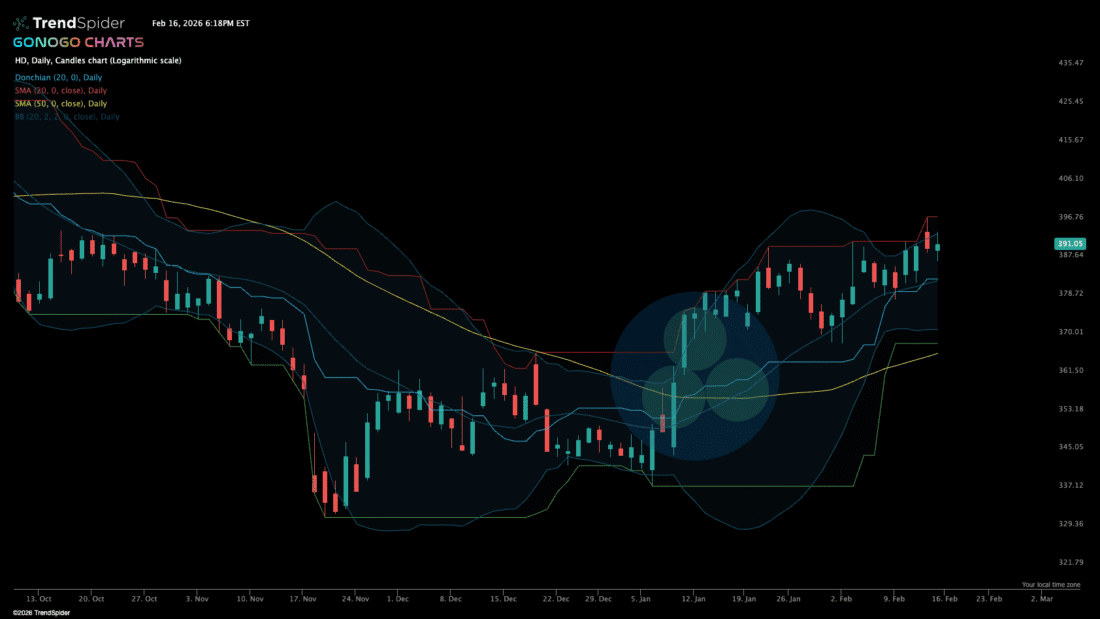
Moving averages are used throughout the investing community because knowing where price is trading relative to a moving average is very helpful. If price is trading above its moving average, this is inherently bullish, as we know that price in the short term is higher than its historical average. Traders have driven the price relatively higher. Two moving averages are often used to create a moving average crossover system where a signal is given if the shorter average crosses above the longer average (circle 2)
To stack the odds further in our favor, we can add another indicator to the chart. Bollinger bands are a mainstay in our industry. These bands are plotted using 2 standard deviations around a mean. Statistics teaches us that 95% of a normally distributed data set should fall within 2 standard deviations. Of course, financial data is not normally distributed, but when price trades outside of these bands it is significant! Often, a new trend begins this way. We see price trading up to and out of the upper band in the circle labeled “3”.
“Go” Trend Appears
Having added the prior indicators, we find ourselves creating a disciplined checklist where each met criteria brings a little extra peace of mind. The described process so far is just the beginning, but we see a new high using Donchian channels, a bullish moving average crossover, and price trading up and out of the Bollinger Bands. We start to become more confident that we have identified a new trend in the upward direction! However, even with just these indicators, we cannot be sure when to act. Each criteria hits at a different time, all within the larger blue circle. When can we be sure?
You can also imagine that if we were to continue to develop our process, adding more indicators to increase confidence we could succumb to analysis paralysis. Including important insights from momentum, volume and volatility analysis would render our price chart complex and overwhelmingly hard to read. Could we be unable to see the trend forest for the technical trees?
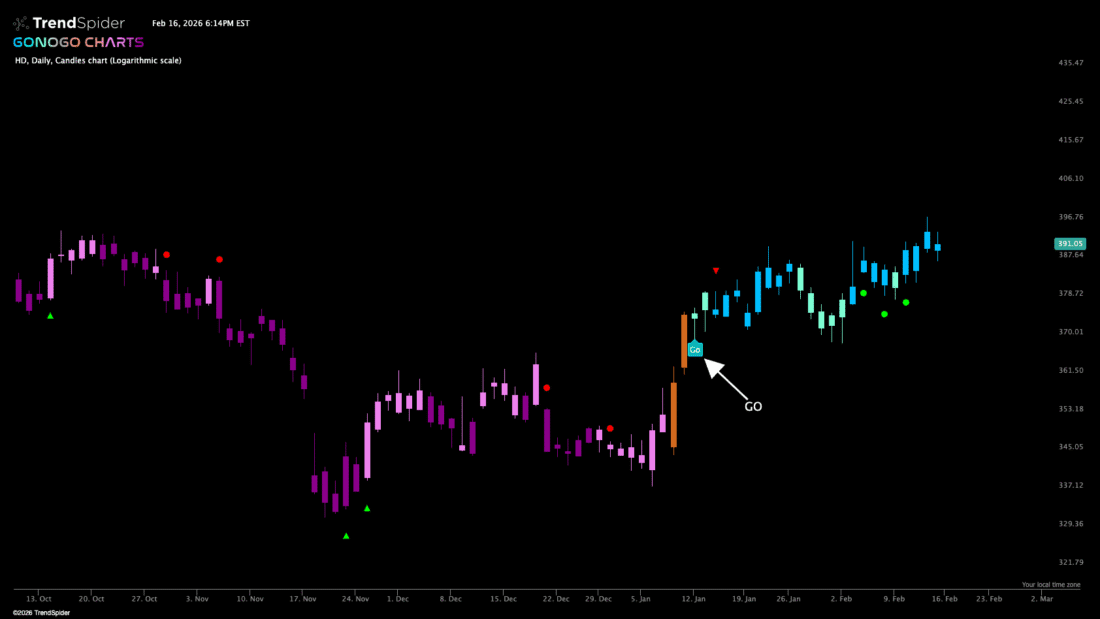
In this last chart, we see the prices of Home Depot, Inc, with the GoNoGo Trend indicator applied. This indicator blends in the background some of the foundational and commonly used technical analysis concepts and indicators, and color codes the price bar according to the strength of its trend. In this way, price remains the focus yet we hold on to our increased confidence from our weight of the evidence approach. We have annotated an arrow to show where the “Go” trend is identified.
—
Originally posted 17th February 2026
Investopedia.com: The comments, opinions and analyses expressed herein are for informational purposes only and should not be considered individual investment advice or recommendations to invest in any security or to adopt any investment strategy. While we believe the information provided herein is reliable, we do not warrant its accuracy or completeness. The views and strategies described on our content may not be suitable for all investors. Because market and economic conditions are subject to rapid change, all comments, opinions and analyses contained within our content are rendered as of the date of the posting and may change without notice. The material is not intended as a complete analysis of every material fact regarding any country, region, market, industry, investment or strategy. This information is intended for US residents only.
Information posted on IBKR Campus that is provided by third-parties does NOT constitute a recommendation that you should contract for the services of that third party. Third-party participants who contribute to IBKR Campus are independent of Interactive Brokers and Interactive Brokers does not make any representations or warranties concerning the services offered, their past or future performance, or the accuracy of the information provided by the third party. Past performance is no guarantee of future results.
This material is from Investopedia and is being posted with its permission. The views expressed in this material are solely those of the author and/or Investopedia and Interactive Brokers is not endorsing or recommending any investment or trading discussed in the material. This material is not and should not be construed as an offer to buy or sell any security. It should not be construed as research or investment advice or a recommendation to buy, sell or hold any security or commodity. This material does not and is not intended to take into account the particular financial conditions, investment objectives or requirements of individual customers. Before acting on this material, you should consider whether it is suitable for your particular circumstances and, as necessary, seek professional advice.
Related Articles


Join The Conversation
For specific platform feedback and suggestions, please submit it directly to our team using these instructions.
If you have an account-specific question or concern, please reach out to Client Services.
We encourage you to look through our FAQs before posting. Your question may already be covered!