
- Solve real problems with our hands-on interface
- Progress from basic puts and calls to advanced strategies
Interactive Options Course
Posted April 29, 2025 at 10:32 am
1/ Life, Nature, and Finance
2/ Time to Head South
3/ Is it Correlated?
Investopedia is partnering with CMT Association on this newsletter. The contents of this newsletter are for informational and educational purposes only, however, and do not constitute investing advice. The guest authors, which may sell research to investors, and may trade or hold positions in securities mentioned herein do not represent the views of CMT Association or Investopedia. Please consult a financial advisor for investment recommendations and services.
Life, Nature, and Finance
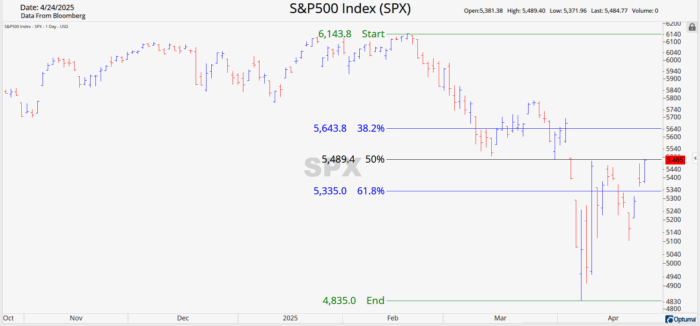
Life, nature, and finance, these seemingly unrelated fields are connected by a fascinating sequence of adding one number to the next, then adding the sum of those two numbers to the previous number. The significance of this sequence lies in its ability to identify crucial patterns, including in the markets. The Fibonacci Sequence has a rich history dating back to 200 BC, but it gained widespread recognition through the work of Leonardo Fibonacci, the Italian mathematician after whom it is named. Technicians have been utilizing this sequence since the 1930s to identify pivotal support and resistance levels, and help predict future price movements.

Courtesy of Optuma
Currently, the S&P 500 has run into significant resistance at the 50% Fibonacci retracement level, which marks the distance from the peak to the trough of this current drawdown. This level coincides with the exact same point where the market gapped down after the tariff announcements, now firmly serving as overhead resistance. Notably, the Fibonacci Sequence has perfectly aligned with the current down trend line of the S&P 500 since its peak, further emphasizing this level’s psychological significance. The convergence of these two indicators signal not only the importance of this level, but hint as to the momentum and strength needed to overcome them. As the market prepares for the weekend, many traders will close out their positions to minimize potential risks during the market’s weekend closure. The closing price of the S&P 500 today will hold immense importance, as a successful closure above these levels will indicate a bullish takeover of the market and possibly indicating a shift in market sentiment. Failure to overcome this level will signal more time is needed to get us out of this drawdown.
Time to Head South
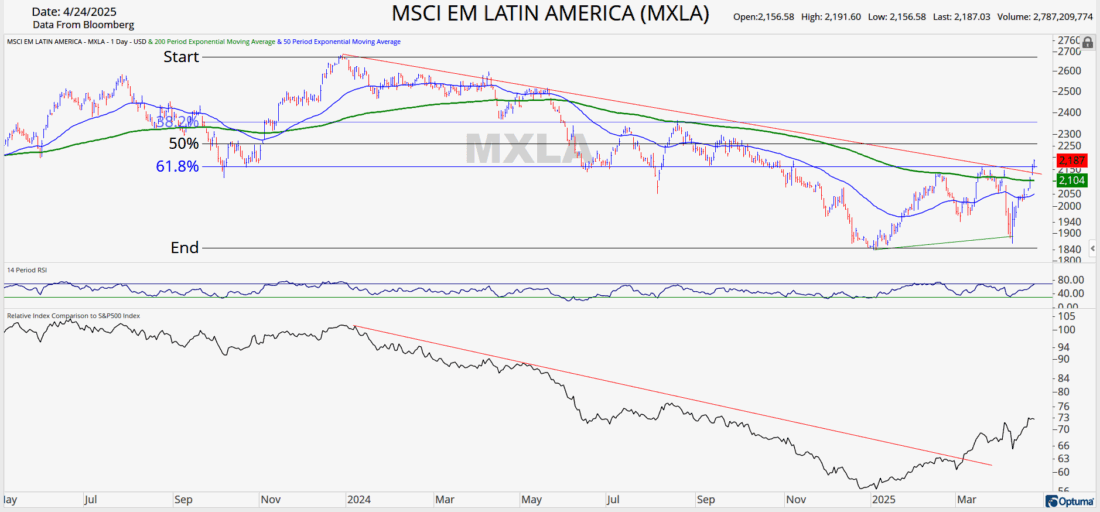
Courtesy of Optuma
The MSCI EM Latin America index is showing classic signs of a potential breakout. It’s great when you can see various signs of improvement in a security’s price action coming together to confirm the possibility of a new uptrend. First, the index has broken above a long-term downtrend that commenced in 2023. Additionally, it has risen above the 200 Day Moving Average (200 DMA), another crucial trend indicator. Secondly, the relative breakout against the S&P 500, a significant benchmark for many US-based investors, adds to the positive signals. Third, the higher lows set in the past few weeks indicate that the index had descended too low, drawing investors back into the market. Lastly, the breakout above the 61.8% retracement level, calculated from the peak to trough during the drawdown, further supports the potential trend change. This retracement aligns with multiple support and resistance levels, suggesting that the index has cleared this zone.
While some may interpret the RSI as overbought, it’s important to remember that the RSI remaining overbought can indicate strength from sustained demand for a security. Putting together multiple indicators for signs of trend change is helpful in confirming a thesis, and when looking at new investments.
Is it Correlated?
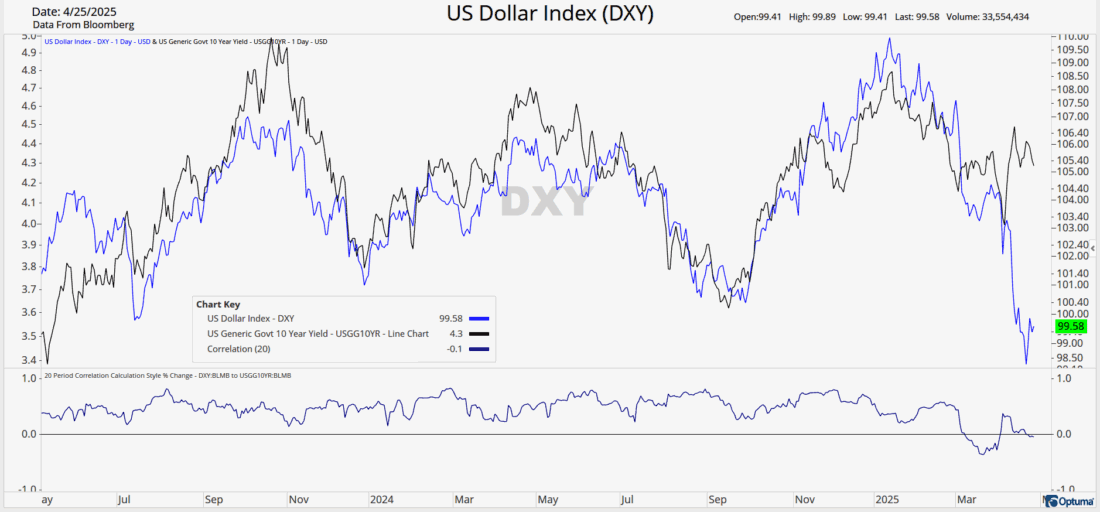
Courtesy of Optuma
The chart above plots the US Dollar Index (DXY) against the US Treasury 10-year yield over the past two years. Even without examining the bottom panel of the 20-period correlation between the two assets, it’s evident of their strong correlation. Highly correlated assets can provide important information about the markets, and decisions being made by investors. Throughout the two-year period, the 20-day correlation remained positive until March of this year. From there, you can observe the divergence between the 10-year yield and the DXY, which sets up a potential trade opportunity. In recent days as the markets have stabilized after the post-tariff volatility, you can see the two assets starting to converge. The correlation had reverted to the positive and now sits just below the center line. While other technical indicators may be more suitable for determining the optimal time to go long the DXY or long bonds (lower yields, higher bond prices), charts like these can be instrumental in identifying potential trade setups. The pull of these two correlated assets back to their mean can provide investors with potential opportunities.
—-
Originally posted 25 April 2025
Investopedia.com: The comments, opinions and analyses expressed herein are for informational purposes only and should not be considered individual investment advice or recommendations to invest in any security or to adopt any investment strategy. While we believe the information provided herein is reliable, we do not warrant its accuracy or completeness. The views and strategies described on our content may not be suitable for all investors. Because market and economic conditions are subject to rapid change, all comments, opinions and analyses contained within our content are rendered as of the date of the posting and may change without notice. The material is not intended as a complete analysis of every material fact regarding any country, region, market, industry, investment or strategy. This information is intended for US residents only.
Information posted on IBKR Campus that is provided by third-parties does NOT constitute a recommendation that you should contract for the services of that third party. Third-party participants who contribute to IBKR Campus are independent of Interactive Brokers and Interactive Brokers does not make any representations or warranties concerning the services offered, their past or future performance, or the accuracy of the information provided by the third party. Past performance is no guarantee of future results.
This material is from Investopedia and is being posted with its permission. The views expressed in this material are solely those of the author and/or Investopedia and Interactive Brokers is not endorsing or recommending any investment or trading discussed in the material. This material is not and should not be construed as an offer to buy or sell any security. It should not be construed as research or investment advice or a recommendation to buy, sell or hold any security or commodity. This material does not and is not intended to take into account the particular financial conditions, investment objectives or requirements of individual customers. Before acting on this material, you should consider whether it is suitable for your particular circumstances and, as necessary, seek professional advice.
Any discussion or mention of an ETF is not to be construed as recommendation, promotion or solicitation. All investors should review and consider associated investment risks, charges and expenses of the investment company or fund prior to investing. Before acting on this material, you should consider whether it is suitable for your particular circumstances and, as necessary, seek professional advice.
There is a substantial risk of loss in foreign exchange trading. The settlement date of foreign exchange trades can vary due to time zone differences and bank holidays. When trading across foreign exchange markets, this may necessitate borrowing funds to settle foreign exchange trades. The interest rate on borrowed funds must be considered when computing the cost of trades across multiple markets.
Municipal Bonds are only available from Interactive Brokers for IBKR LLC, IBKR Canada, IBKR Hong Kong, IBKR Australia and IBKR Singapore entities.
Spot currencies are not available at IBKR Singapore.
Related Articles


Join The Conversation
For specific platform feedback and suggestions, please submit it directly to our team using these instructions.
If you have an account-specific question or concern, please reach out to Client Services.
We encourage you to look through our FAQs before posting. Your question may already be covered!