
- Solve real problems with our hands-on interface
- Progress from basic puts and calls to advanced strategies
Interactive Options Course
Posted March 13, 2025 at 9:44 am
1/ High Yield Spreads Widen to Six Month High
2/ Nvidia Bounces Off Downtrend Channel Support
3/ Micron Settles Into Consolidation Phase
Investopedia is partnering with CMT Association on this newsletter. The contents of this newsletter are for informational and educational purposes only, however, and do not constitute investing advice. The guest authors, which may sell research to investors, and may trade or hold positions in securities mentioned herein do not represent the views of CMT Association or Investopedia. Please consult a financial advisor for investment recommendations and services.
High Yield Spreads Widen to Six Month High
High yield credit spreads have widened to their highest levels since September 2024. And while we’ve observed plenty of risk-off signs so far in 2025, this one is perhaps even more concerning as it involves a cohort of investors that are usually well-attuned to market risks. With both high yield spreads and the VIX increasing over the last month, two key measures of market sentiment are now signaling a risk-off environment.
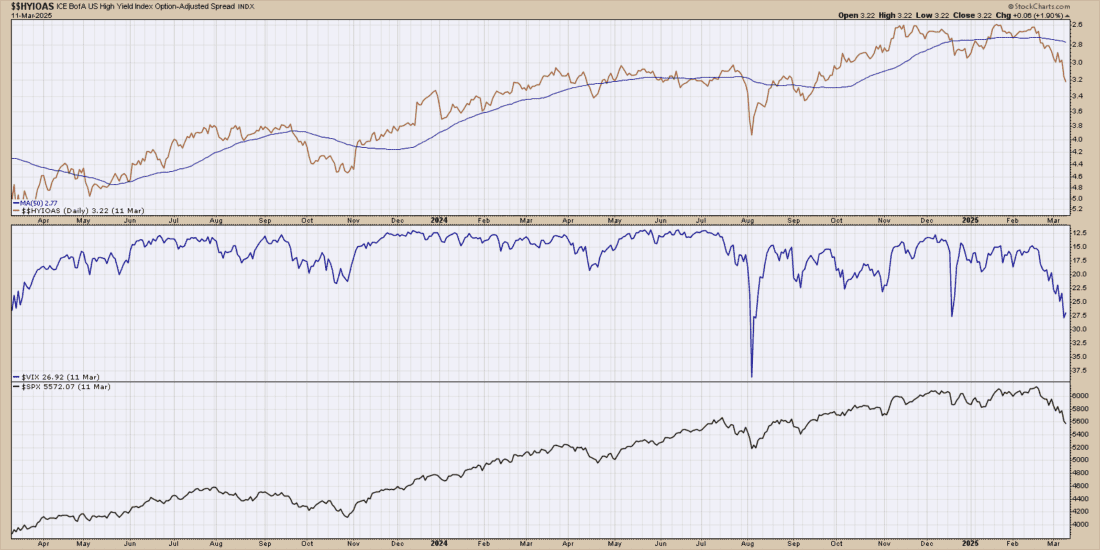
Courtesy of StockCharts.com
The top panel shows the ICE BofA US High Yield Index Option Adjusted Spread, plotted using an inverse scale. The second panel shows the VIX, again using an inverted scale, followed by the S&P 500 in the bottom panel. The first two panels use an inverted scale because higher values tend to coincide with weaker stock prices.
We can see that credit spreads were narrowing through most of 2024, reaching some of the lowest levels on record in Q4 2024 through the beginning of this year. This suggests bond investors were perceiving a risk-on environment, pricing in a low probability that companies would be unwilling to meet their debt obligations. This widening of high yield spreads over the last four weeks suggests another “change of character” for stocks, as bond investors begin to perceive elevated probability of defaults.
Nvidia Bounces Off Downtrend Channel Support
Shares of NVIDIA Corp. (NVDA) popped higher on Wednesday after almost two straight weeks of daily declines. This countertrend bounce off the lower end of a downtrend channel is very much in line with a short-term upswing within a larger bearish technical structure.
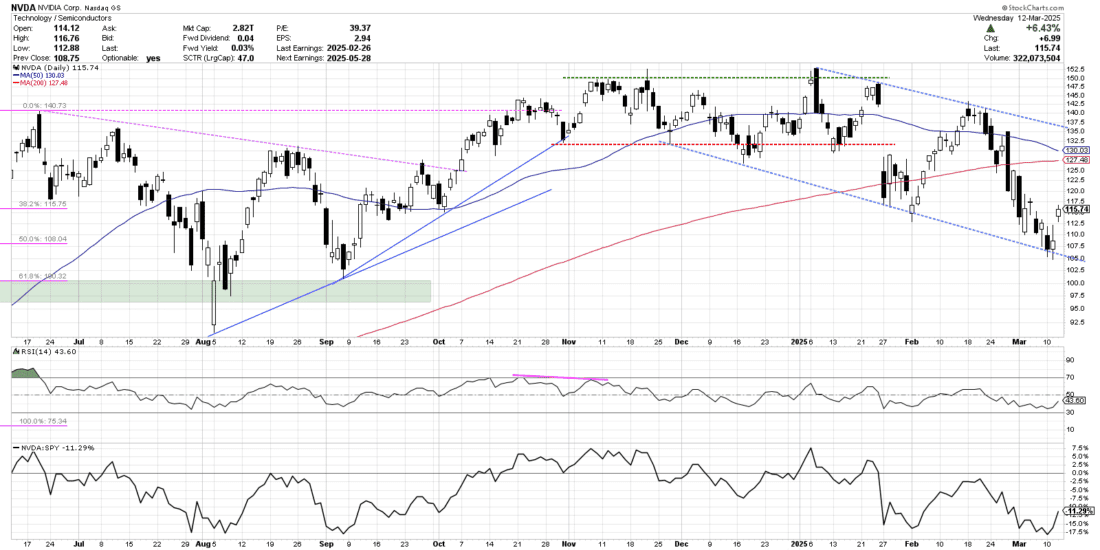
Courtesy of StockCharts.com
When NVDA gapped lower in mid-January, this took the stock well below a key support level around $132. And while the upswing in early February took NVDA back into the range of the previous consolidation phase, bears once again took control to further validate a downtrend channel featuring parallel trendlines of support and resistance.
While this week’s bounce appears bullish on the surface, a further evaluation shows that this could perhaps just be a natural upturn after testing the lower trendline. While a short-term bounce could provide a swing trade opportunity on the short-term time frame, the medium-term bearish structure would remain intact as long as NVDA remains below trendline resistance using the upper end of the channel. As always, a pattern of lower highs and lower lows means the price is in a confirmed downtrend!
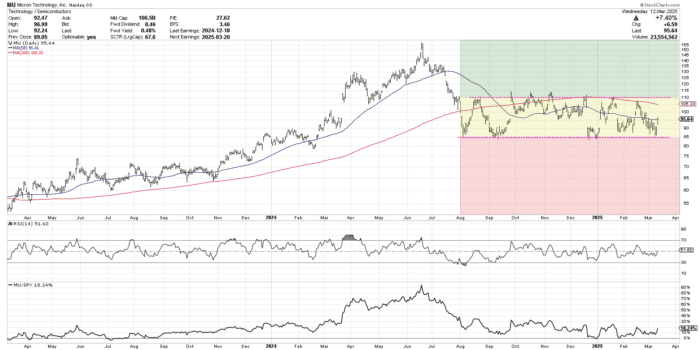
Micron Settles Into Consolidation Phase
While many semiconductor names have flashed clear distribution signs in recent weeks, Micron Technology (MU) remains firmly entrenched in a consolidation phase. Here we’ll demonstrate the “stoplight” approach to identify opportunities if and when the stock finally exits this sideways trend phase.
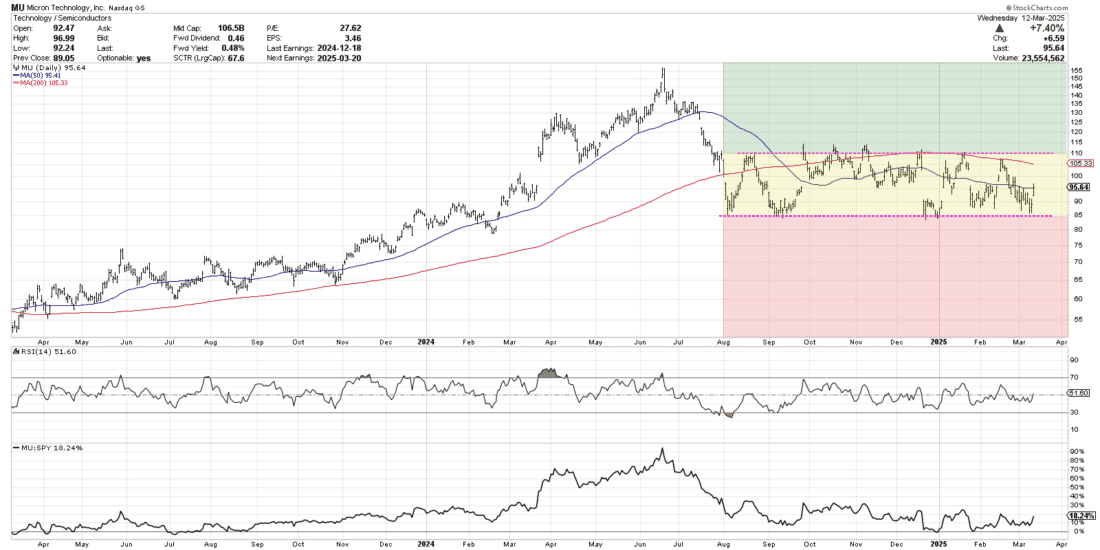
Courtesy of StockCharts.com
After last summer’s drop from a peak around $155 to a swing low at $85, Micron settled into a sideways trend that has lasted almost eight months. MU has bounced between support at $85 and resistance around $110 numerous times, with the 200-day moving average also reinforcing resistance during that period.
In this sort of situation, I tend to favor a stoplight approach based on the validated support and resistance levels. If MU can push to a new swing high above $110, that would suggest a potential retest of the 2024 high. A drop below support around $85 would confirm a new swing low and imply a high likelihood for much weaker price action going forward. In the meantime, given the well-established price range and anemic momentum readings, investors are perhaps best served by looking elsewhere for actionable opportunities.
—-
Originally posted 13th March 2025
Investopedia.com: The comments, opinions and analyses expressed herein are for informational purposes only and should not be considered individual investment advice or recommendations to invest in any security or to adopt any investment strategy. While we believe the information provided herein is reliable, we do not warrant its accuracy or completeness. The views and strategies described on our content may not be suitable for all investors. Because market and economic conditions are subject to rapid change, all comments, opinions and analyses contained within our content are rendered as of the date of the posting and may change without notice. The material is not intended as a complete analysis of every material fact regarding any country, region, market, industry, investment or strategy. This information is intended for US residents only.
Information posted on IBKR Campus that is provided by third-parties does NOT constitute a recommendation that you should contract for the services of that third party. Third-party participants who contribute to IBKR Campus are independent of Interactive Brokers and Interactive Brokers does not make any representations or warranties concerning the services offered, their past or future performance, or the accuracy of the information provided by the third party. Past performance is no guarantee of future results.
This material is from Investopedia and is being posted with its permission. The views expressed in this material are solely those of the author and/or Investopedia and Interactive Brokers is not endorsing or recommending any investment or trading discussed in the material. This material is not and should not be construed as an offer to buy or sell any security. It should not be construed as research or investment advice or a recommendation to buy, sell or hold any security or commodity. This material does not and is not intended to take into account the particular financial conditions, investment objectives or requirements of individual customers. Before acting on this material, you should consider whether it is suitable for your particular circumstances and, as necessary, seek professional advice.
Any discussion or mention of an ETF is not to be construed as recommendation, promotion or solicitation. All investors should review and consider associated investment risks, charges and expenses of the investment company or fund prior to investing. Before acting on this material, you should consider whether it is suitable for your particular circumstances and, as necessary, seek professional advice.
Municipal Bonds are only available from Interactive Brokers for IBKR LLC, IBKR Canada, IBKR Hong Kong, IBKR Australia and IBKR Singapore entities.
Related Articles


?")


Join The Conversation
For specific platform feedback and suggestions, please submit it directly to our team using these instructions.
If you have an account-specific question or concern, please reach out to Client Services.
We encourage you to look through our FAQs before posting. Your question may already be covered!