
- Solve real problems with our hands-on interface
- Progress from basic puts and calls to advanced strategies
Interactive Options Course

Posted November 12, 2025 at 9:16 am
1/ Healthcare Sector Ignites a Rare Overbought Signal
2/ Brazil’s Bullish Breakout Driven by Commodity Demand
3/ Europe Rallies to 52-Week Highs Amidst Bearish Divergence
4/ Biotech Sector Breaks Out with Relative Strength, Eyes $115 Target
5/ Semiconductors, Market Quarterback Rebounds, Eyes $370 After Strategic Dip
Investopedia is partnering with CMT Association on this newsletter. The contents of this newsletter are for informational and educational purposes only, however, and do not constitute investing advice. The guest authors, which may sell research to investors, and may trade or hold positions in securities mentioned herein do not represent the views of CMT Association or Investopedia. Please consult a financial advisor for investment recommendations and services.
Healthcare Sector Ignites a Rare Overbought Signal
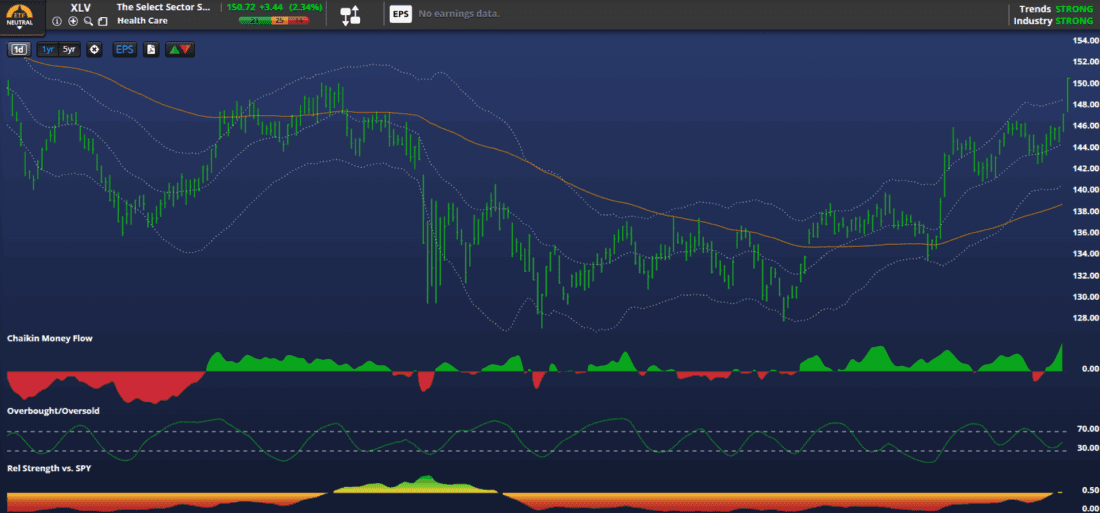
The Healthcare Sector SPDR ETF (XLV) registered a significant technical event Tuesday, surging 2.3% to establish fresh 52-week highs and generating a rare overbought signal with its Relative Strength Index (RSI) spiking to 78—the first time all year. This move caps a remarkable bullish stretch, with XLV recording almost all green days since November 3rd and only one down day since October 30th. This sustained buying pressure has firmly established the bullish trend, reflected by the 200-day moving average starting its ascent after serving as a hard ceiling for months.
A crucial moment for this rally was the September 30th close above the 200-day moving average, which had previously held firm at the $139.00 level. Furthermore, the impressive strength of this move is evidenced by the continuous trading above the 40 RSI level since the 52-week low was struck back on May 15th at $127.00. While the enthusiasm is palpable and the sector is clearly in favor, traders should acknowledge that the price is currently extending well outside its upper Bollinger Band, a signal of short-term exhaustion.
Given this robust breakout, patient and tactical entries around the $145.00 level following any shallow dip will likely be well-rewarded. However, make no mistake: this is not a quiet consolidation; the current enthusiasm has not been this strong all year, indicating significant institutional conviction behind the move. Prudent technical analysis suggests scaling into positions while setting tight stop-losses beneath the nearest psychological support to manage the inevitable volatility that follows such a major extension.
Brazil’s Bullish Breakout Driven by Commodity Demand

The iShares MSCI Brazil ETF (EWZ) was powerfully accumulated this Tuesday, surging 2.3% to establish a new 52-week high while also flashing an overbought signal with its Relative Strength Index (RSI) hitting 78. This breakout aligns with a continued rotation into global and emerging markets, signaling strong technical confidence in the Brazilian equity space. The foundation of this rally was laid in August when the 200-day moving average began to rise, coinciding precisely with the initial break above the critical $29.00 level.
That $29.00 mark proved to be pivotal, as the ETF’s slip back to that price in October successfully retested the rising 200-day support before reversing higher. Notably, EWZ has not registered an oversold reading since the ugly bear market bottom in December when it bottomed at $22.00, underscoring the resilience of its recent uptrend. This current momentum, however, finds the ETF significantly extended, placing it outside of typical short-term comfort zones and indicating an imminent need for consolidation.
As a commodity-sensitive nation, Brazil’s rally is heavily correlated to improving sentiment across the Energy and Materials sectors, providing an alternative exposure vehicle for global investors. Prudent technical analysis suggests that patient entries on pullbacks near the $31.00 level will likely be well-rewarded, offering a safer entry point into this powerful momentum. The current high RSI signals strong conviction, but risk-managed entries are required to capitalize on this global rotation theme effectively.
Europe Rallies to 52-Week Highs Amidst Bearish Divergence

The European market rally continues, with the Vanguard FTSE European ETF (VGK) achieving new 52-week highs on a significant momentum pickup. The foundation for this sustained move was laid in May with a powerful breakout above the $73.50 level, which coincided with an initial overbought reading. This established a bullish stair-step pattern, leading to higher monthly closes near $79.00 in July and $81.00 in October, placing the ETF now on the precipice of $82.00.
While the momentum has been firmly bullish, a notable technical anomaly warrants attention: a bearish divergence is currently registering a modest RSI of 61 despite posting a 52-week price high. This low RSI, compared to previous peaks, suggests that the current buying power is less broad-based, making the ETF vulnerable to short-term profit-taking. Despite this, VGK has demonstrated remarkable resilience, having not been technically oversold since the global market volatility experienced in April.
Given this conflict between price action and momentum, an immediate entry is suboptimal, and a pullback is likely justified. Prudent entries near the psychological and technical support of $80.00 would be more appropriate for positioning. Should such a drop occur, entries at this level will likely be rewarded as the ETF tests its immediate target and current resistance near $82.00.
Biotech Sector Breaks Out with Relative Strength, Eyes $115 Target
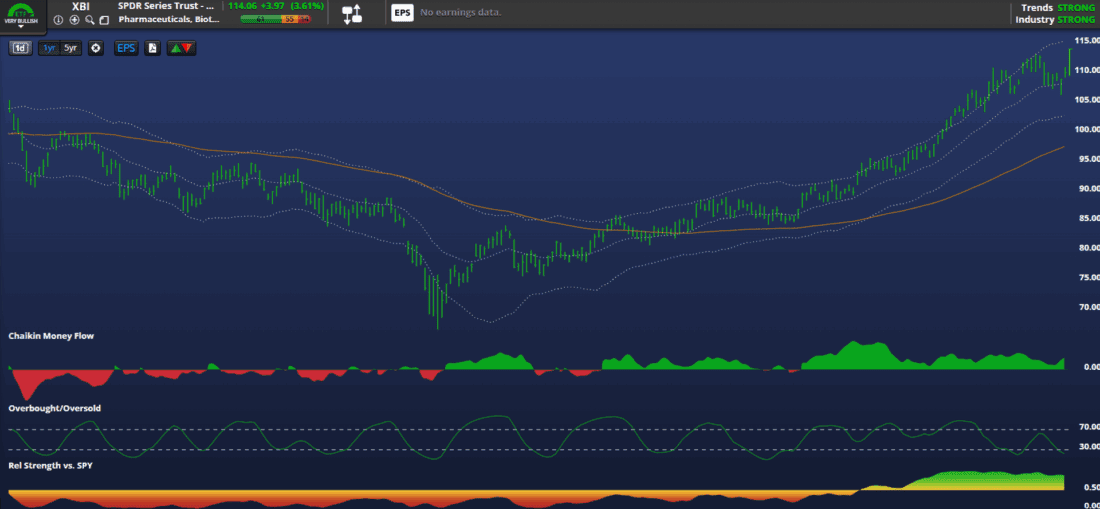
The S&P Biotech ETF (XBI) has reached new 52-week highs, concluding a protracted period of consolidation that saw the ETF spend much of the year constrained beneath a declining 200-day moving average. This trend decisively reversed in mid-August, with a closing price above the 200 DMA signaling a significant shift in market structure. The subsequent bullish action led to an October breakout above the $100 level, where an RSI reading of 70 confirmed robust strength and momentum, proving the ETF was poised to run further.
Since September 1st, XBI has displayed powerful relative strength, consistently outpacing the broader S&P 500 index. Like other global risk-on assets, the only time this basket of names registered an oversold measure occurred in April during the widespread volatility scare. However, while the ETF posts a new price peak, a classic bearish divergence is forming, with the Relative Strength Index (RSI) only reaching a modest reading of 67.
This divergence suggests the short-term rally may be due for a brief period of profit-taking before continuing its advance. The immediate forecast is for a bullish two weeks, targeting the $115 resistance before any significant digestion of gains. A patient entry at $108.50 would be prudent, as this technical level represents a strong area of support and an ideal entry point following the anticipated slip.
Semiconductors, Market Quarterback Rebounds, Eyes $370 After Strategic Dip
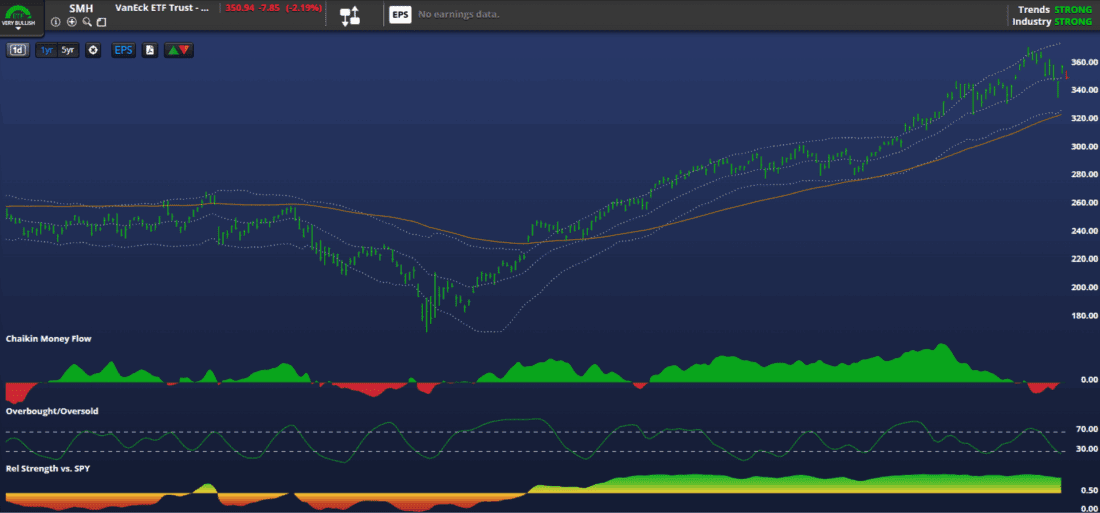
The semiconductor sector, represented by the SMH ETF, remains the market’s leading quarterback despite a 2.2% dip on Tuesday, closing near $352.00. Comprising essential AI and massive movers like NVDA and Broadcom, the sector reached its all-time high of $373.00 on October 29th, solidifying its dominant position. Since mid-May, this group has consistently beaten the SPY head-to-head in terms of relative strength, a testament to continuous institutional conviction.
The “off to the races” breakout truly commenced in mid-May when the ETF finally closed above a flatlining 200-day moving average near the $270.00 level. The subsequent momentum was immense, resulting in overbought periods in May, June, half of July, and again from mid-September into mid-October. Following the October all-time high, the ETF experienced a sharp profit-taking dip on November 7th, forming a very strong bullish hammer reversal when it touched $337.00.
While the ETF is setting up for a strong rebound, a slight technical divergence exists, as the most recent all time high was accompanied by an RSI of only 72. This potential lack of broad momentum, with the current RSI around 53, suggests a tactical entry is required rather than chasing the immediate rebound. Prudent entries around the $350.00 level look likely to be rewarded, setting the stage for a push toward the $370.00 target by early December.
—
Originally posted 12th November 2025
Investopedia.com: The comments, opinions and analyses expressed herein are for informational purposes only and should not be considered individual investment advice or recommendations to invest in any security or to adopt any investment strategy. While we believe the information provided herein is reliable, we do not warrant its accuracy or completeness. The views and strategies described on our content may not be suitable for all investors. Because market and economic conditions are subject to rapid change, all comments, opinions and analyses contained within our content are rendered as of the date of the posting and may change without notice. The material is not intended as a complete analysis of every material fact regarding any country, region, market, industry, investment or strategy. This information is intended for US residents only.
Information posted on IBKR Campus that is provided by third-parties does NOT constitute a recommendation that you should contract for the services of that third party. Third-party participants who contribute to IBKR Campus are independent of Interactive Brokers and Interactive Brokers does not make any representations or warranties concerning the services offered, their past or future performance, or the accuracy of the information provided by the third party. Past performance is no guarantee of future results.
This material is from Investopedia and is being posted with its permission. The views expressed in this material are solely those of the author and/or Investopedia and Interactive Brokers is not endorsing or recommending any investment or trading discussed in the material. This material is not and should not be construed as an offer to buy or sell any security. It should not be construed as research or investment advice or a recommendation to buy, sell or hold any security or commodity. This material does not and is not intended to take into account the particular financial conditions, investment objectives or requirements of individual customers. Before acting on this material, you should consider whether it is suitable for your particular circumstances and, as necessary, seek professional advice.
Any discussion or mention of an ETF is not to be construed as recommendation, promotion or solicitation. All investors should review and consider associated investment risks, charges and expenses of the investment company or fund prior to investing. Before acting on this material, you should consider whether it is suitable for your particular circumstances and, as necessary, seek professional advice.
Related Articles


Join The Conversation
For specific platform feedback and suggestions, please submit it directly to our team using these instructions.
If you have an account-specific question or concern, please reach out to Client Services.
We encourage you to look through our FAQs before posting. Your question may already be covered!