
- Solve real problems with our hands-on interface
- Progress from basic puts and calls to advanced strategies
Interactive Options Course

Posted April 15, 2025 at 9:15 am
Stocks in Focus with Jay Woods, CMT
1/ Goldman Sachs (GS)
2/ Johnson & Johnson (JNJ)
3/ Netflix (NFLX)
Investopedia is partnering with CMT Association on this newsletter. The contents of this newsletter are for informational and educational purposes only, however, and do not constitute investing advice. The guest authors, which may sell research to investors, and may trade or hold positions in securities mentioned herein do not represent the views of CMT Association or Investopedia. Please consult a financial advisor for investment recommendations and services.
Goldman Sachs (GS)
Goldman Sachs (GS) reports on the heels of JP Morgan’s (JPM) solid results that saw its shares rally by 12.3% and recapture its 200-day moving average.
Watch the trading revenue numbers as added volatility should help their bottom line exceed expectations. The implied one day move for earnings day is +/- 7.7% and if the market is moving that morning then expect a possible bigger move.
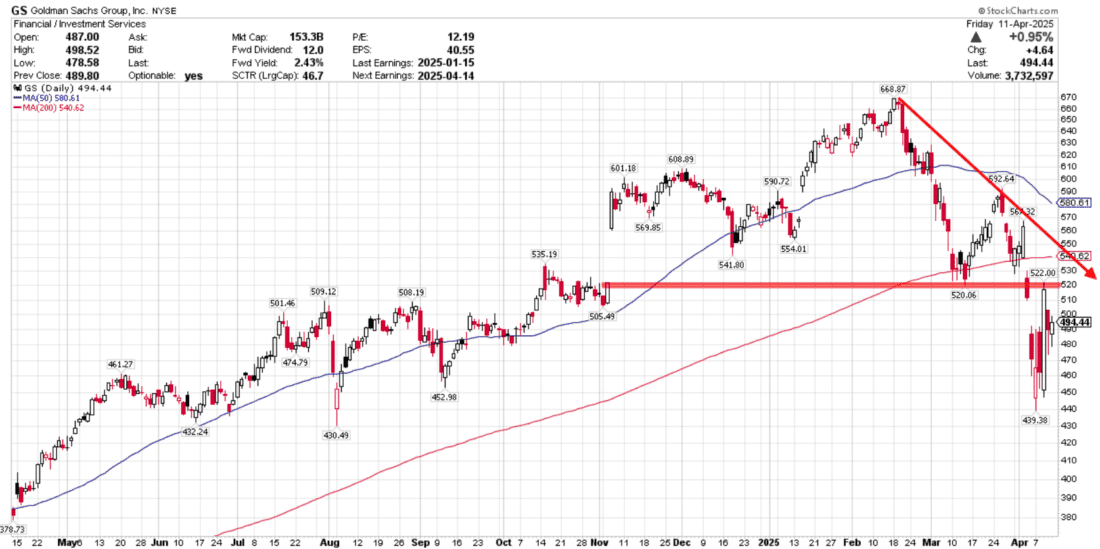
Technically, shares have been put through the ringer. Price has broken many key trendlines and support levels along the way. Maybe, just maybe, we have found a floor.
Like most stocks in this current environment, the swings have been wild. Lines in the sand have been drawn and maybe GS can follow JPM’s lead as the charts are quite similar.
Things have been extremely volatile; the range between support and resistance is wide. The $440/$450 area looks to be a strong area of support for now. However, the trend has changed and there has been much technical damage done. There are levels of resistance above, but it seems more likely that they may get tested faster to the upside than any retest of the lows.
On a rally watch the $520 level from which it broke down after breaching its 200-day moving average. If shares eclipse that, it is likely we will experience a run back to that $540 area at its 200-day. That would also take shares back to its new downtrend line and should be met with much selling pressure.
Johnson & Johnson (JNJ)
Johnson & Johnson (JNJ) has experienced some of the wildest swings since making a new high back in early March. Shares have fallen over 16% and look to get back to its winning ways when they report on Tuesday.
Year-to-date, shares are up 5% and in one of the strongest sectors for those playing defense. Like all companies reporting, focus will be on management’s commentary on future earnings guidance and potential impacts from global economic conditions.
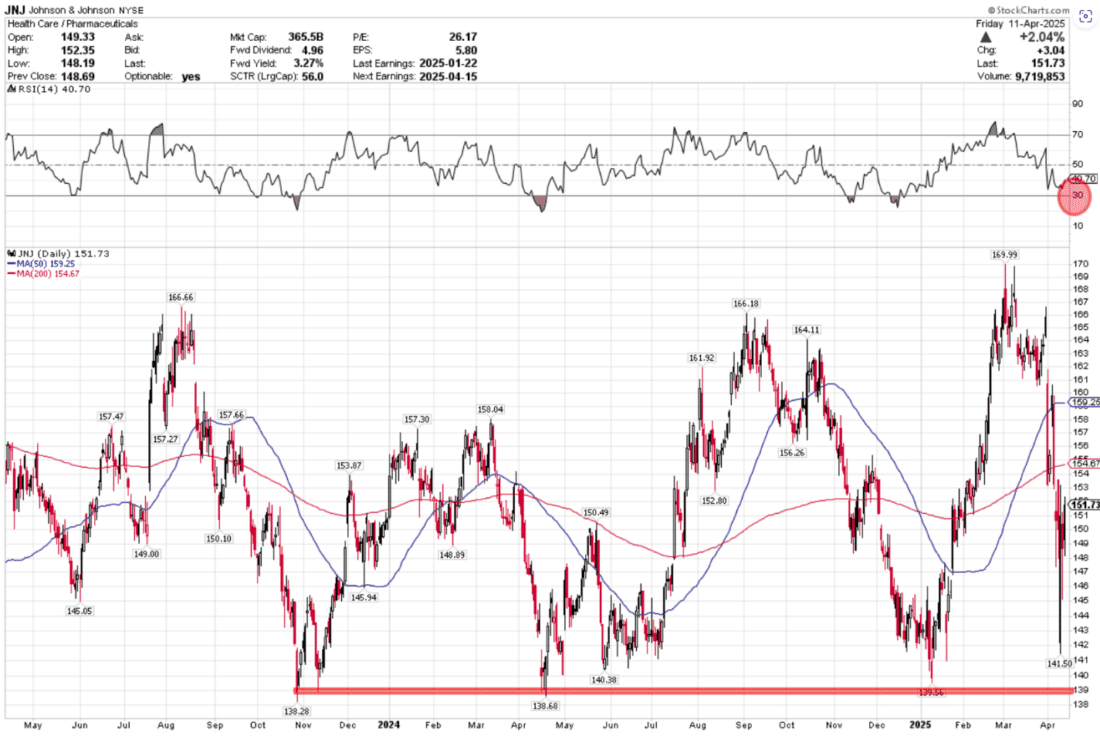
Technically, shares are in a bit of a no-man’s land. Price action has been streaky and now they report in the middle of this recent wide range.
The bear case to be made is that shares have yet to reach oversold levels and major support so more of a downside could be reached before jumping into the stock.
The bull case at worst is a reversion back to the 200-day moving average just above current levels. The best case is that it has little tariff exposure and remains a safer haven in tough times and may run back towards old highs.
Overall, outside a safe 3.3% dividend, the case to jump in for a trade is tough to make given recent price action.
Netflix (NFLX)
Netflix (NFLX) has given back all of its gains from its last earnings cycle and hopes it can regain those levels when they report on Thursday.
Shares are seen as a safer haven in this tariff war environment but have not been immune to the wild market swings we have been seeing. It has continued to put up solid numbers and fared better than most growth stocks during this time.
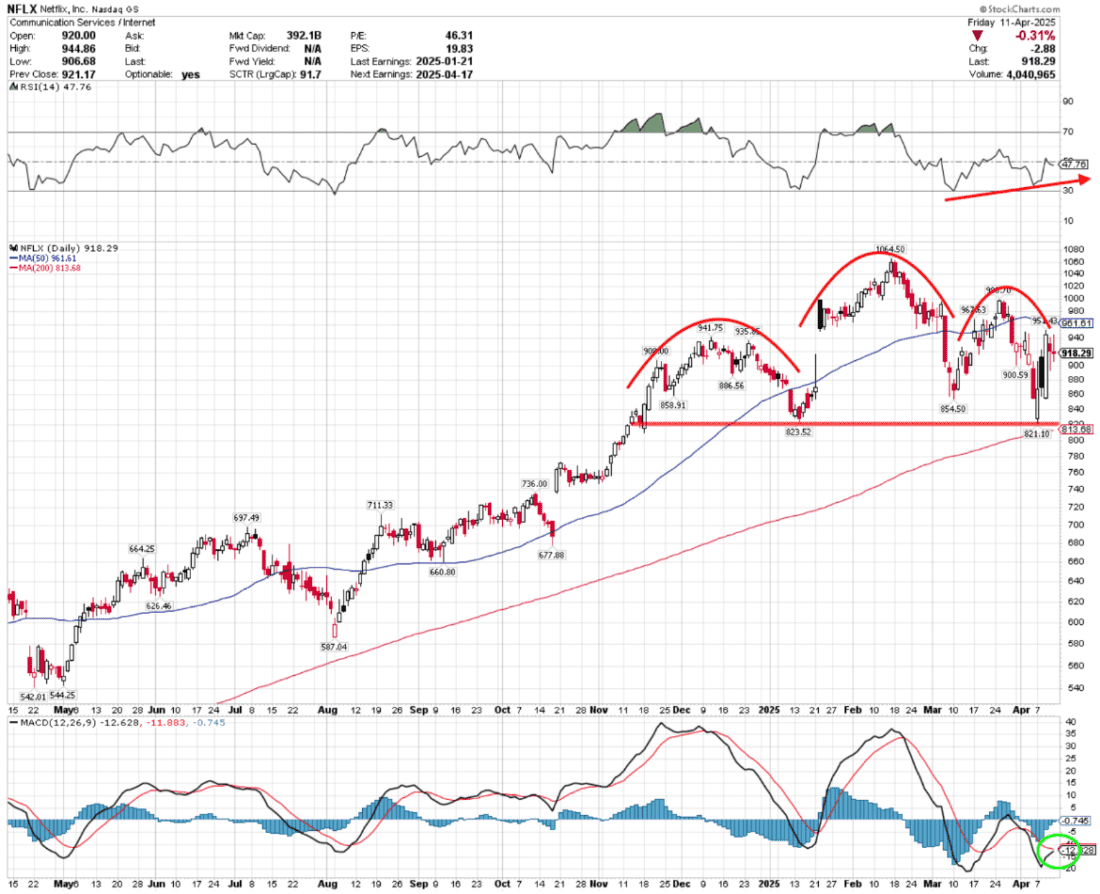
Technically, there are several more positives than negatives.
Shares had formed a head-and-shoulders top but failed to break its neckline at the $820 level and bounced. That was one positive development, but the pattern still hangs over the stock for now.
Secondly, we see a bullish divergence in its RSI when comparing that to recent price action. As price made new lows the RSI did not. That tells us something has changed and this recent sell-off was not as strong as its predecessor and that a reversal may be coming.
Lastly, we may be experiencing a bullish crossover in its MACD. We have seen this lead to a rally in price more often than not and could be telling us that we are about to see an upward move. Let’s see if we get price action to confirm this during the week.
We have a history of gaps after earnings so watch that gap and price action immediately afterwards. If we experience a gap higher and above the 50-day moving average, one can use that as a stop to manage risk. To the downside, watch to see if the $820 level holds. If it doesn’t it could lead to an accelerated move to the downside.
—
Originally posted 15th April 2025
Investopedia.com: The comments, opinions and analyses expressed herein are for informational purposes only and should not be considered individual investment advice or recommendations to invest in any security or to adopt any investment strategy. While we believe the information provided herein is reliable, we do not warrant its accuracy or completeness. The views and strategies described on our content may not be suitable for all investors. Because market and economic conditions are subject to rapid change, all comments, opinions and analyses contained within our content are rendered as of the date of the posting and may change without notice. The material is not intended as a complete analysis of every material fact regarding any country, region, market, industry, investment or strategy. This information is intended for US residents only.
Information posted on IBKR Campus that is provided by third-parties does NOT constitute a recommendation that you should contract for the services of that third party. Third-party participants who contribute to IBKR Campus are independent of Interactive Brokers and Interactive Brokers does not make any representations or warranties concerning the services offered, their past or future performance, or the accuracy of the information provided by the third party. Past performance is no guarantee of future results.
This material is from Investopedia and is being posted with its permission. The views expressed in this material are solely those of the author and/or Investopedia and Interactive Brokers is not endorsing or recommending any investment or trading discussed in the material. This material is not and should not be construed as an offer to buy or sell any security. It should not be construed as research or investment advice or a recommendation to buy, sell or hold any security or commodity. This material does not and is not intended to take into account the particular financial conditions, investment objectives or requirements of individual customers. Before acting on this material, you should consider whether it is suitable for your particular circumstances and, as necessary, seek professional advice.
Related Articles


Join The Conversation
For specific platform feedback and suggestions, please submit it directly to our team using these instructions.
If you have an account-specific question or concern, please reach out to Client Services.
We encourage you to look through our FAQs before posting. Your question may already be covered!