
- Solve real problems with our hands-on interface
- Progress from basic puts and calls to advanced strategies
Interactive Options Course
Posted January 28, 2026 at 9:22 am
1/ Emerging Markets!
2/ Value + Momentum Blend
3/ Gold vs. Stocks
Investopedia is partnering with CMT Association on this newsletter. The contents of this newsletter are for informational and educational purposes only, however, and do not constitute investing advice. The guest authors, which may sell research to investors, and may trade or hold positions in securities mentioned herein do not represent the views of CMT Association or Investopedia. Please consult a financial advisor for investment recommendations and services.
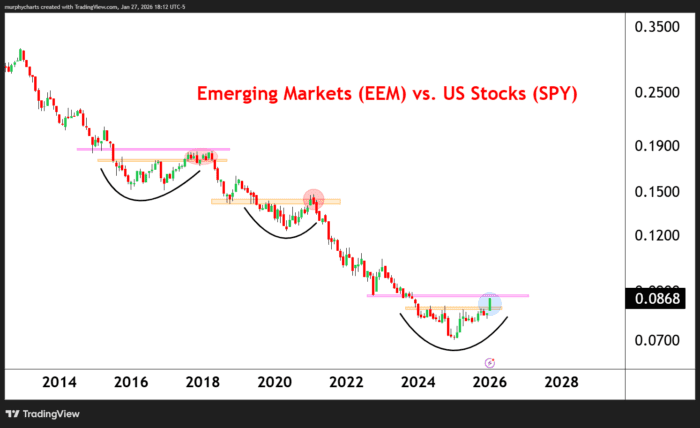
Emerging Markets!
Emerging market stocks are shining in 2026. With the help of a declining US dollar, Emerging markets are +10% year-to-date. Absolute prices are breaking out to new all-time highs, and the relative trend (EEM / SPY) is displaying evidence of reversal.

The above chart displays the 15yr history of EEM / SPY. We’ve seen periods more recently (2017-18 and 2021) when the price ratio has appeared to reverse trend but ultimately failed to hold key technical levels. We’ll see how things resolve this go-around. Emerging market stocks making new highs is certainly “risk-on” behavior. The type of positioning investors take in a bull market!
Value + Momentum Blend
Two equity factors that work quite well together are Value and Momentum. It’s been noted by many that a blended strategy of Value and Momentum can at times outperform each individual strategy on both an absolute and risk-adjusted basis. When evaluating the ratio charts below, you can understand why.

The chart displays Momentum vs. SPY (blue line) overlayed with Value vs. SPY (red line). The Value ratio is set on an inverted scale. The lines appear to move with one another, meaning that in reality, when Momentum is outperforming the broad market, Value is underperforming and vice versa. This can help reduce portfolio drawdowns and subdue momentum price shocks we see far too often.
Gold vs. Stocks
I’m not big on price analogs – they aren’t valuable in my opinion, but man are they interesting. The below compares the Q1 1973 breakout of Gold vs. Stocks to the Q1 2026 breakout. In both instances, Inflation was cooling following a big rise in the preceding years. The Gold vs. SPY breakout occurs at this inflection point, where inflation re-accelerates and Gold prices soar over stocks. Will we see something similar this time around?

—
Originally posted 28th January 2026
Investopedia.com: The comments, opinions and analyses expressed herein are for informational purposes only and should not be considered individual investment advice or recommendations to invest in any security or to adopt any investment strategy. While we believe the information provided herein is reliable, we do not warrant its accuracy or completeness. The views and strategies described on our content may not be suitable for all investors. Because market and economic conditions are subject to rapid change, all comments, opinions and analyses contained within our content are rendered as of the date of the posting and may change without notice. The material is not intended as a complete analysis of every material fact regarding any country, region, market, industry, investment or strategy. This information is intended for US residents only.
Information posted on IBKR Campus that is provided by third-parties does NOT constitute a recommendation that you should contract for the services of that third party. Third-party participants who contribute to IBKR Campus are independent of Interactive Brokers and Interactive Brokers does not make any representations or warranties concerning the services offered, their past or future performance, or the accuracy of the information provided by the third party. Past performance is no guarantee of future results.
This material is from Investopedia and is being posted with its permission. The views expressed in this material are solely those of the author and/or Investopedia and Interactive Brokers is not endorsing or recommending any investment or trading discussed in the material. This material is not and should not be construed as an offer to buy or sell any security. It should not be construed as research or investment advice or a recommendation to buy, sell or hold any security or commodity. This material does not and is not intended to take into account the particular financial conditions, investment objectives or requirements of individual customers. Before acting on this material, you should consider whether it is suitable for your particular circumstances and, as necessary, seek professional advice.
Any discussion or mention of an ETF is not to be construed as recommendation, promotion or solicitation. All investors should review and consider associated investment risks, charges and expenses of the investment company or fund prior to investing. Before acting on this material, you should consider whether it is suitable for your particular circumstances and, as necessary, seek professional advice.
There is a substantial risk of loss in foreign exchange trading. The settlement date of foreign exchange trades can vary due to time zone differences and bank holidays. When trading across foreign exchange markets, this may necessitate borrowing funds to settle foreign exchange trades. The interest rate on borrowed funds must be considered when computing the cost of trades across multiple markets.
Exchange Traded Commodities (ETCs) are only available from Interactive Brokers for IBKR LLC, IBKR Canada, IBKR Hong Kong and IBKR Singapore entities.
Spot currencies are not available at IBKR Singapore.
Related Articles


Join The Conversation
For specific platform feedback and suggestions, please submit it directly to our team using these instructions.
If you have an account-specific question or concern, please reach out to Client Services.
We encourage you to look through our FAQs before posting. Your question may already be covered!