
- Solve real problems with our hands-on interface
- Progress from basic puts and calls to advanced strategies
Interactive Options Course

Posted June 2, 2026 at 1:13 pm
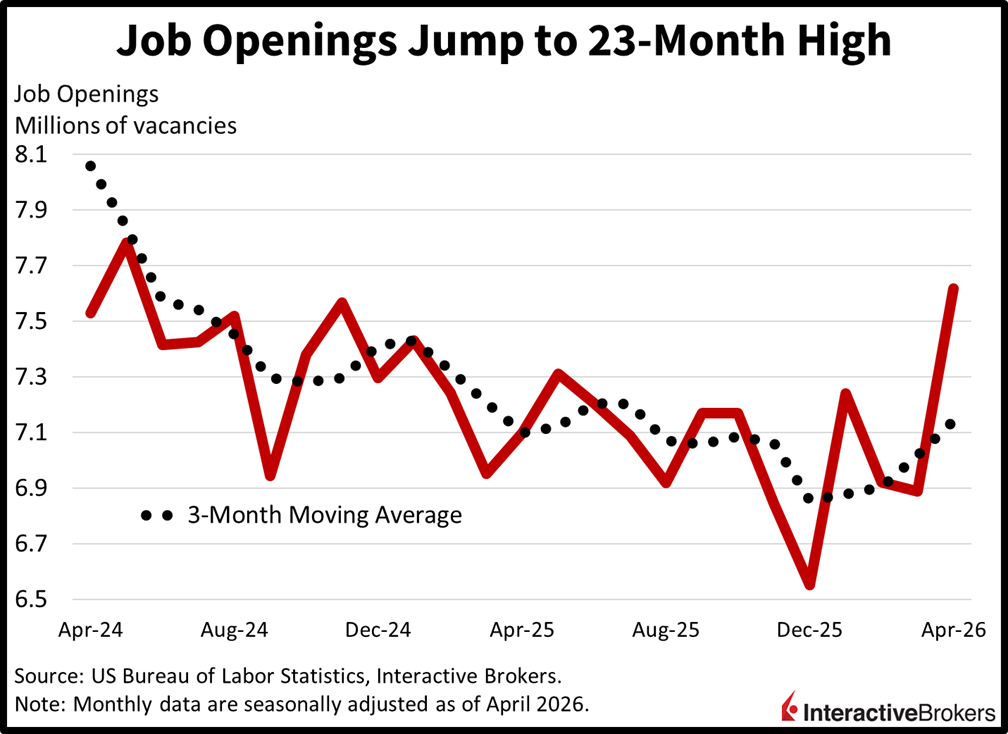
Stocks recovered from morning losses and leaped to fresh records today following an intraday JOLTS report signaling that corporations still need workers after all. The big beat featuring a 23-month high in job openings occurs as investors worry that AI might be disrupting industries and eliminating employment opportunities. What’s ironic is that tech leader Google reported before the opening bell that it’s executing an $80 billion secondary equity offering to fund AI expansion as its debt load rises amidst slowing buybacks and declining free cash flows. The development is raising concerns regarding heavy expenses for AI that are happening against the backdrop of uncertain profitability profiles; however, strengthening confidence of a solid economy is countering those worries. Meanwhile, the Middle East situation hasn’t changed much since yesterday, as President Trump expresses optimism about striking a deal in the near future, which is causing interest rates, the greenback and crude oil to move sideways. Equities and commodities are broadly positive with 7 of the 11 major sectors advancing while precious metals and cyclical raw inputs catch bids. Elsewhere, cryptocurrencies are getting battered, volatility protection instruments are nearly unchanged and prediction markets are experiencing engagement.
For-hire signs jumped to a 23-month high in April as corporate demand for workers strengthened significantly. The 7.618 million headline figure in the Job Openings and Labor Turnover Survey (JOLTS) blew past the median estimate of 6.88 million and March’s 6.887 million. The 731k month-over-month (m/m) gain could be mostly attributed to the professional/business services sector, which added 668k. Health care/social assistance, other services, government, transportation/warehousing/utilities, construction and manufacturing also contributed with increases of 89k, 62k, 47k, 34k, 25k and 24k. Finance/insurance, leisure/hospitality and retail weighed on results, however, with decreases of 135k, 67k and 43k.
Today’s announcement about Google needing more money to fund its AI capital ambitions signals an expensive path ahead, especially in light of the Magnificent 7 member being one of the most profitable companies in the world. Conversely, this morning’s reported surge in job openings occurs as workers are getting cheaper relative to prices across the economy, as the employment cost index and average pay checks increase slower than inflation. I’m expecting this counterbalance to persist, as firms realize the appropriate amount of tech and employees needed for specific tasks, with both inputs working alongside each other to bolster profitability and economic growth. We’ve learned from the past that jobs are dynamic and change with time as people fill gaps in the workplace against the backdrop of a constantly evolving landscape. We’ve seen these labor reallocations that have been sparked by technology, such as ATM machines, computers, ecommerce, airport counters, assembly line automation, the printing press and typewriters, fail to result in heightened unemployment.
The euro area’s Harmonized Consumer Price Index (HCPI) depicted cost pressures accelerating from the April 3% year-over-year (y/y) increase to 3.2% last month while the monthly pace slowed to 0.1% from 1%. The HCPI ex Energy and Food, however, was more benign, posting 2.5% and 0.3% y/y and m/m gains following April’s 2.2% and 0.8% ascents. For the broad gauge, the m/m result was curtailed by energy costs slipping 1.1% following two months of strong gains as a result of the Middle East crisis. Unprocessed foods, furthermore, became 0.2% less expensive. Conversely, services providers boosted their fees by 0.4% while the non-energy industrial goods group and the processed food, alcohol and tobacco category became 0.2% and 0.1% more costly.
South Korea’s May inflation was stronger than expected with higher energy costs pushing the annualized Consumer Price Index (CPI) rate to the highest level since March 2024. Meanwhile, the monthly pace of inflation was unchanged from April. The CPI was up 3.1% y/y, according to the Ministry of Data and Statistics. The print, which exceeded the economist consensus estimate of 3%, accelerated from 2.6% in April. Meanwhile, the monthly rate repeated April’s 0.5% and was hotter than the consensus estimate of 0.3%. When excluding food and energy, the CPI was up 2.5% y/y and 0.5% m/m. Within the broader gauge, higher energy prices pushed the cost of transportation up 11.6% y/y. Petroleum stickers soared 24.2% and international airfare surged 33.5%. Also in May, recreation and culture climbed 5% while the miscellaneous goods and services category was up 4.1%. The clothing and footwear category and the restaurants and hotels group jumped 2.8% and 2.7%. Within the m/m print, recreation and culture led with a 1.8% gain. The transport classification and the clothing and footwear segment followed with stickers ascending 1.5% and 0.9%.
The value of retail sales in Hong Kong during April was up 8.6% y/y after March’s 12.8% ascent, according to a preliminary estimate from the Census and Statistics Department. Cashier transactions in the category of motor vehicles and parts led with a 46.1% surge. Consumers rushed to purchase automobiles prior to the expiration of a tax incentive program.
Other segments with stronger activity and the extent of their changes were as follows:
In other matters, consumers appeared to have balked at higher energy prices with sales of fuels sinking 11.7%. Commodities in department stores and the category of Chinese herbs and drugs also weakened with declines of 1.9% and 8.5%.
Australia’s trade produced a $27.1 billion deficit during the first quarter of this year, according to the Australian Bureau of Statistics (ABS). It was the first time that the value of imports exceeded exports since the quarter ended in December 2017. Cyclones limited exports of iron ore, coal and other mining commodities. In addition, the price of iron ore fell. Exports of goods sank 1.2% while services were lower by 1.3%. Higher energy costs, meanwhile, caused the value of imports to expand. Purchases of computer server racks and other AI products from foreign providers also accelerated. The ABS estimates that the deficit will trim 0.8 percentage points from first quarter gross domestic product.
New to Interactive Brokers?
Open AccountInformation posted on IBKR Campus that is provided by third-parties does NOT constitute a recommendation that you should contract for the services of that third party. Third-party participants who contribute to IBKR Campus are independent of Interactive Brokers and Interactive Brokers does not make any representations or warranties concerning the services offered, their past or future performance, or the accuracy of the information provided by the third party. Past performance is no guarantee of future results.
This material is from IBKR Macroeconomics, an affiliate of Interactive Brokers LLC, and is being posted with its permission. The views expressed in this material are solely those of the author and/or IBKR Macroeconomics and Interactive Brokers is not endorsing or recommending any investment or trading discussed in the material. This material is not and should not be construed as an offer to buy or sell any security. It should not be construed as research or investment advice or a recommendation to buy, sell or hold any security or commodity. This material does not and is not intended to take into account the particular financial conditions, investment objectives or requirements of individual customers. Before acting on this material, you should consider whether it is suitable for your particular circumstances and, as necessary, seek professional advice.
Futures, event contracts, and forecast contracts are not suitable for all investors. Before trading these products, please read the CFTC Risk Disclosure. For a copy, visit our Warnings and Disclosures Page.
Investments in certain commodities (precious metals) may be subject to significant price volatility and often involve risks related to market fluctuations, liquidity constraints, geopolitical events, and changes in global economic conditions that could adversely affect their value.
Trading in digital assets, including cryptocurrencies, is especially risky and is only for individuals with a high risk tolerance and the financial ability to sustain losses. Eligibility to trade in digital asset products may vary based on jurisdiction.
Related Articles


Join The Conversation
For specific platform feedback and suggestions, please submit it directly to our team using these instructions.
If you have an account-specific question or concern, please reach out to Client Services.
We encourage you to look through our FAQs before posting. Your question may already be covered!