
- Solve real problems with our hands-on interface
- Progress from basic puts and calls to advanced strategies
Interactive Options Course
Posted November 10, 2025 at 9:27 am
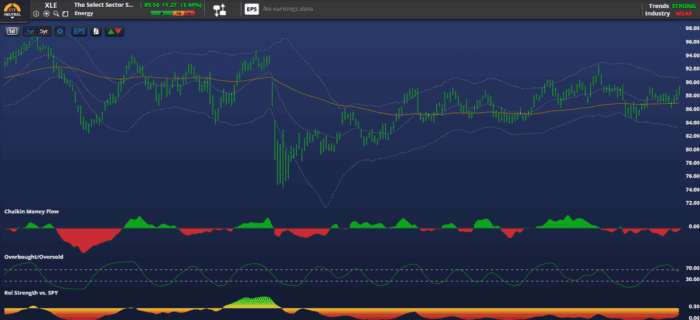
1/ Energy Nears Critical $90 Resistance
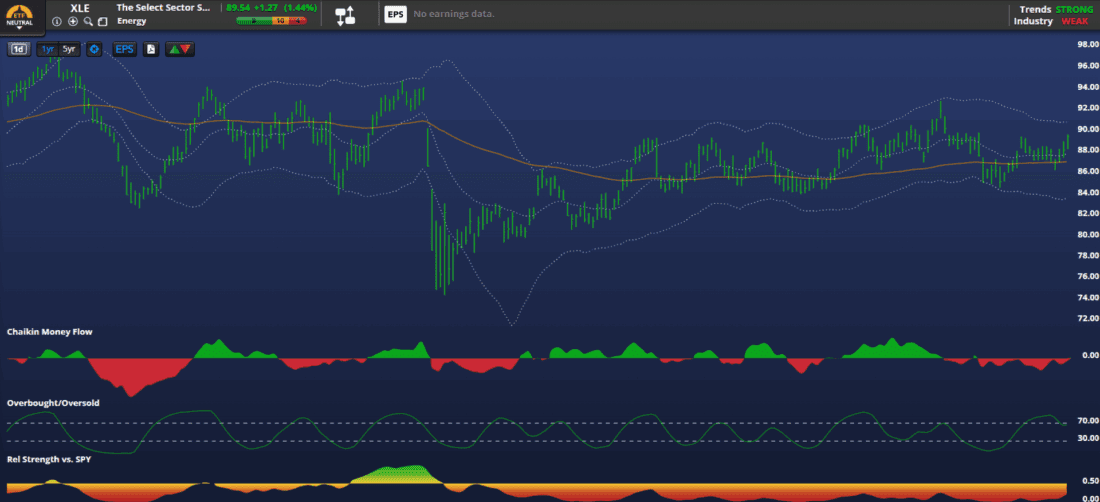
2/ Consumer Staples Bounce Confirms $75 Floor, But Momentum Lags
3/ Utilities Chart Targets All-Time High at $93
4/ Uranium Washout Creates Tactical $45 Long Setup
5/ Ethereum Reversal Requires Stability at $25
Investopedia is partnering with CMT Association on this newsletter. The contents of this newsletter are for informational and educational purposes only, however, and do not constitute investing advice. The guest authors, which may sell research to investors, and may trade or hold positions in securities mentioned herein do not represent the views of CMT Association or Investopedia. Please consult a financial advisor for investment recommendations and services.
Energy Nears Critical $90 Resistance
Amid rising inflation concerns and a clear flight to defensive sectors, the Energy Sector SPDR (XLE) advanced 1.4% on Friday. While this movement confirms renewed institutional interest, the long-term technical structure is fundamentally constrained. The price is currently up against resistance provided by its sliding 200-day moving average located near $87. This recent recovery has pushed the Relative Strength Index (RSI) to 58, reflecting the highest short-term momentum the ETF has shown since late September.
Analysis of the 52-week price range shows XLE trading well below its Thanksgiving peak of $98 but comfortably above its April low of $74. Technically, the $90 price handle represents a formidable near-term psychological and price ceiling that will be challenging to overcome without a fundamental catalyst.
This imbalance projects XLE into a near-term consolidation phase, where it is likely to re-test the established $86–$87 support range over the coming 2 weeks. Traders should wait for a decisive breakout above the $90 ceiling before establishing new long exposure. Alternatively, given the chart’s constrained structure, equity derivatives players may prioritize defined-risk short strategies to capitalize on a pullback toward long-term support.
Consumer Staples Bounce Confirms $75 Floor, But Momentum Lags
Capital prioritized inelastic consumer demand and safety on Friday, driving the Consumer Staples Sector SPDR (XLP) 1.5% higher during a defensive rotation. This relief rally follows an extended period of underperformance that culminated in the ETF printing a fresh 52-week low near $75 just Thursday. The low was immediately confirmed by a strong bullish reversal signal, indicating that decisive institutional buying interest emerged right at this major psychological support zone.
Despite the robust close, the Relative Strength Index (RSI) only briefly touched oversold territory, suggesting that underlying bearish pressure has not been fully resolved. Technically, this current rebound is anticipated to be a limited-velocity retracement that is expected to exhaust its momentum within the next two to three weeks. The short-term upside target for this bounce is established at the $78 region, where the price is expected to encounter both initial overhead resistance and the 50-RSI neutral level.
The challenging long-term structural resistance remains at the $80.50 level, making a swift re-test of that previous high unlikely. The sector’s relatively low historical price movement and muted implied volatility discourage aggressive, directional long options strategies. Therefore, traders are better served by deploying risk-defined call spreads or similar credit strategies between $78 and $80 for consistent premium generation while price remains range-bound.
Utilities Chart Targets All-Time High at $93

The Utilities Sector SPDR (XLU) advanced 1.4% on Friday, benefiting from the market’s flight into rate-sensitive, stable sectors and now exhibits one of the market’s most constructive technical setups. This followed a high-magnitude, swift drawdown from $93 to $88, which is a significant shift for this typically slow-moving instrument. XLU appears well-positioned for continued strength over the next two weeks, with an initial target established at the $90 psychological resistance level.
The long-term technical structure suggests the ETF is ultimately destined to challenge its prior all-time high near the $93 price handle. The optimal risk-managed entry zone for establishing long exposure is identified between the $88 and $89, providing an attractive base for the anticipated rally toward new highs. Given the currently low implied volatility of the sector, buying long-dated, out-of-the-money call options is a compelling strategy.
If XLU maintains momentum above the $89 mark next week, traders should initiate a long position targeting the all-time high. Specifically, one could consider purchasing 90 or 91 strike December calls to capitalize on leveraged upside, as implied volatility is expected to expand with the price movement. The potential reward of a move to $93 significantly outweighs the risk when the trade is initiated from the current established support levels.
Uranium Washout Creates Tactical $45 Long Setup
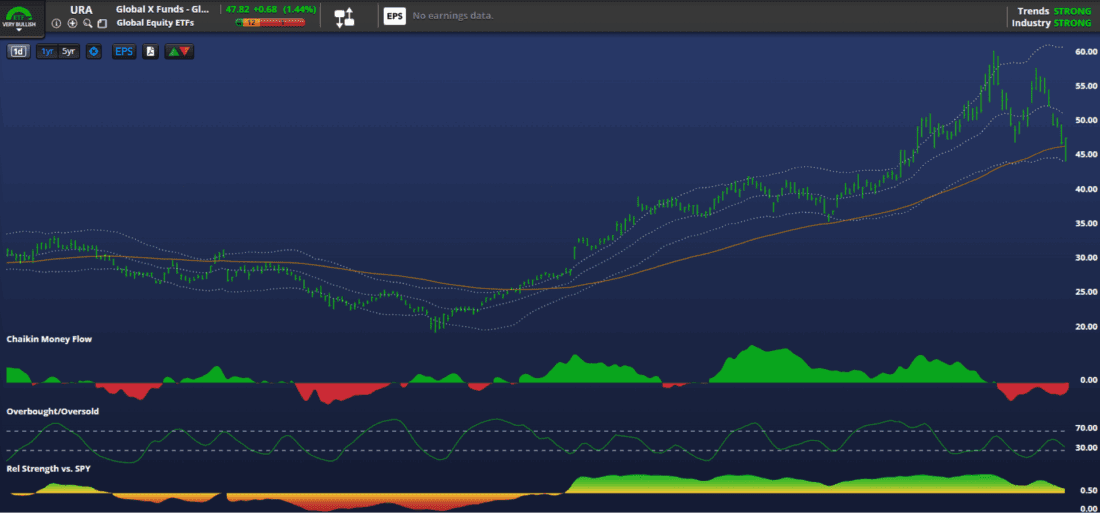
The Global X Uranium ETF (URA) was the most significant weekly casualty in the market, recording a brutal 14% decline that confirms a systemic liquidation phase in high-beta thematic speculative assets. The magnitude of the fall, which erased gains from its $60.50 October 15th peak, is characteristic of aggressive profit-taking rather than a slow, corrective move. Despite the extreme weekly damage, decisive buying interest emerged on Friday, resulting in a +1.4% close that strongly signals a near-term exhaustion of immediate selling pressure.
The current price is situated just above the crucial $45 support level, which is structurally reinforced by the rising 200-day moving average at $35.50. This confluence of technical support is laying the groundwork for a counter-trend opportunity. The tactical upside target for the snap-back is established at the $51 resistance, followed by a high-conviction longer-term target near $59 once the broader market stabilizes.
This volatility favors defined-risk structures for derivatives traders to manage the uncertainty. If price action confirms stability and holds the $45 entry point through the middle of next week, traders should initiate a long call spread (e.g., December $48/$53). URA requires patience, but its significant drawdown is setting up a high-reward trade once technical confirmation of stability is secured.
Ethereum Reversal Requires Stability at $25

The iShares Ethereum Trust (ETHA) recorded an 11% weekly loss, underscoring the aggressive de-risking prevalent across the high-beta, digital asset space. This decline is structurally categorized as profound profit-taking, highlighted by a strong rejection at the 50 Relative Strength Index (RSI) level on October 27th. The long-term bullish trend is currently dependent upon the rising 200-day moving average, which is providing critical structural support near $23.05.
Near-term price action justifies a tactical monitoring of the $25 price handle for a potential high-probability entry point next week. Aggressive overhead resistance is anticipated at the 20 day moving average, $28.55, which aligns with the failure point at the 50 RSI. Given the 24/7 nature of cryptocurrency trading, the final entry decision should be deferred until Monday’s market open to fully assess weekend price action and liquidity.
If stability is confirmed at $25 early next week, traders should initiate a long position with a short-term recovery target set at $33. Due to the need for time-decay management and high-beta risk control, the use of a defined-risk options structure is essential. The purchase of the December $26/$33 call spread is warranted
—
Originally posted 10th November 2025
Investopedia.com: The comments, opinions and analyses expressed herein are for informational purposes only and should not be considered individual investment advice or recommendations to invest in any security or to adopt any investment strategy. While we believe the information provided herein is reliable, we do not warrant its accuracy or completeness. The views and strategies described on our content may not be suitable for all investors. Because market and economic conditions are subject to rapid change, all comments, opinions and analyses contained within our content are rendered as of the date of the posting and may change without notice. The material is not intended as a complete analysis of every material fact regarding any country, region, market, industry, investment or strategy. This information is intended for US residents only.
Information posted on IBKR Campus that is provided by third-parties does NOT constitute a recommendation that you should contract for the services of that third party. Third-party participants who contribute to IBKR Campus are independent of Interactive Brokers and Interactive Brokers does not make any representations or warranties concerning the services offered, their past or future performance, or the accuracy of the information provided by the third party. Past performance is no guarantee of future results.
This material is from Investopedia and is being posted with its permission. The views expressed in this material are solely those of the author and/or Investopedia and Interactive Brokers is not endorsing or recommending any investment or trading discussed in the material. This material is not and should not be construed as an offer to buy or sell any security. It should not be construed as research or investment advice or a recommendation to buy, sell or hold any security or commodity. This material does not and is not intended to take into account the particular financial conditions, investment objectives or requirements of individual customers. Before acting on this material, you should consider whether it is suitable for your particular circumstances and, as necessary, seek professional advice.
Any discussion or mention of an ETF is not to be construed as recommendation, promotion or solicitation. All investors should review and consider associated investment risks, charges and expenses of the investment company or fund prior to investing. Before acting on this material, you should consider whether it is suitable for your particular circumstances and, as necessary, seek professional advice.
Cryptocurrency based Exchange Traded Products (ETPs) are high risk and speculative. Cryptocurrency ETPs are not suitable for all investors. You may lose your entire investment. For more information please view the RISK DISCLOSURE REGARDING COMPLEX OR LEVERAGED EXCHANGE TRADED PRODUCTS.
Related Articles


Join The Conversation
For specific platform feedback and suggestions, please submit it directly to our team using these instructions.
If you have an account-specific question or concern, please reach out to Client Services.
We encourage you to look through our FAQs before posting. Your question may already be covered!