
- Solve real problems with our hands-on interface
- Progress from basic puts and calls to advanced strategies
Interactive Options Course

Posted May 12, 2025 at 10:58 am
By Ryan Redfern, CMT, ChFC
1/ Check in on Seasonality
2/ RRG – Watching the “Ducks”
3/ NAAIM Sentiment vs. Me
Investopedia is partnering with CMT Association on this newsletter. The contents of this newsletter are for informational and educational purposes only, however, and do not constitute investing advice. The guest authors, which may sell research to investors, and may trade or hold positions in securities mentioned herein do not represent the views of CMT Association or Investopedia. Please consult a financial advisor for investment recommendations and services.
It’s great to be back writing the Chart Advisor again all this week! A lot has changed since my week in October, and it will be fun to continue on this journey.
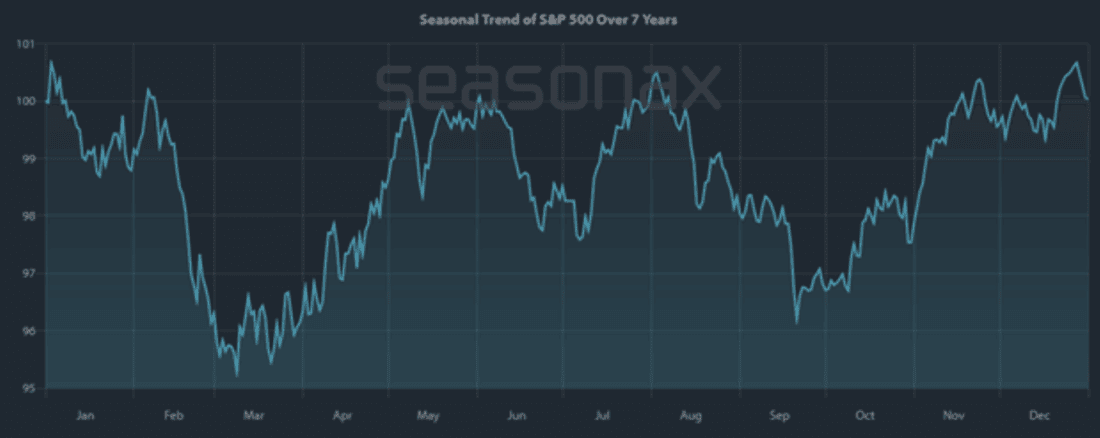
Check in on Seasonality
One of my favorite ways to start the week is to check in on Seasonality. The chart below illustrates the S&P 500’s performance over the past 25 years, specifically during the first year of the presidential cycle, for the seven most recent US presidents. While that’s not a huge sample size, a wide range of scenarios and economic backdrops have tended to act somewhat similarly. And so far, 2025 is following this playbook remarkably well.
Seasonality looks at the average movement of an index, stock, etc., on a given day over the last X number of periods. For this example, I’m looking at the last 7 years of the S&P 500 Index, but only during the first year of a US presidential term.
I find that when seasonality and trend agree, good things can happen. It’s worth a look now and then.
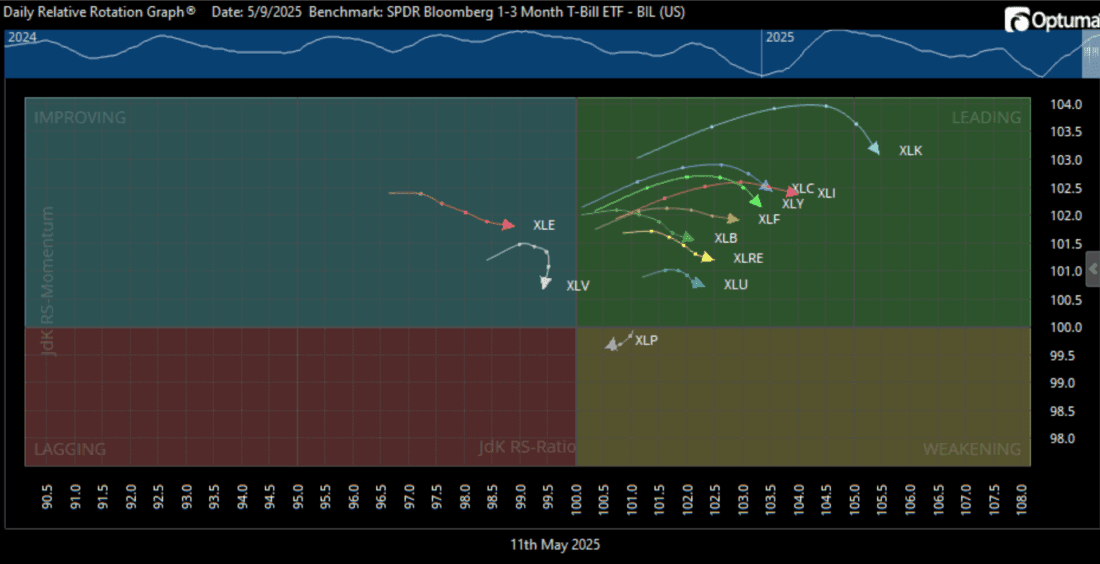
RRG – Watching the “Ducks”
Next up is a look at how the sectors of the S&P 500 are acting relative to T-Bills using RRG (Relative Rotation Graphs) created by Julius de Kempenaer. I like to refer to this as watching the “ducks go around the pond,” as the sectors will tend to rotate in a clockwise circle around the graph.
As of Friday, most sectors of the broad index have moved well into the Green (Leading) box. And that’s great! A few weeks ago, they were all clustered in the Red (Lagging) box, which is where market rallies tend to start. But now, the sectors are looking tired: the arrows are starting to point downward towards the Yellow (Weakening) box. While that isn’t a clear sell signal, it is a condition to pay attention to.
Re-reference the Seasonality chart above and there appears to be a sharp drop sometime in mid-May. If the S&P 500 sectors start to roll over and push downward, then I’d expect a pullback to start. But for now, we still have to watch and wait. We’ll revisit this a couple of times this week to watch it play out.
XLP (Consumer Staples) is already heading towards the exit, and XLV (Healthcare) appears as if it will skip the Green box and go straight back into Red. And way up in the top right – XLK (Technology) is turning over faster than many other sectors. That tends to lead the way in both rallies and pullbacks. So keep an eye on that one.
I post these on Twitter each Friday so you can watch the “ducks” swim their laps.
https://x.com/RyanRedfernCMT/status/1921331884052943146
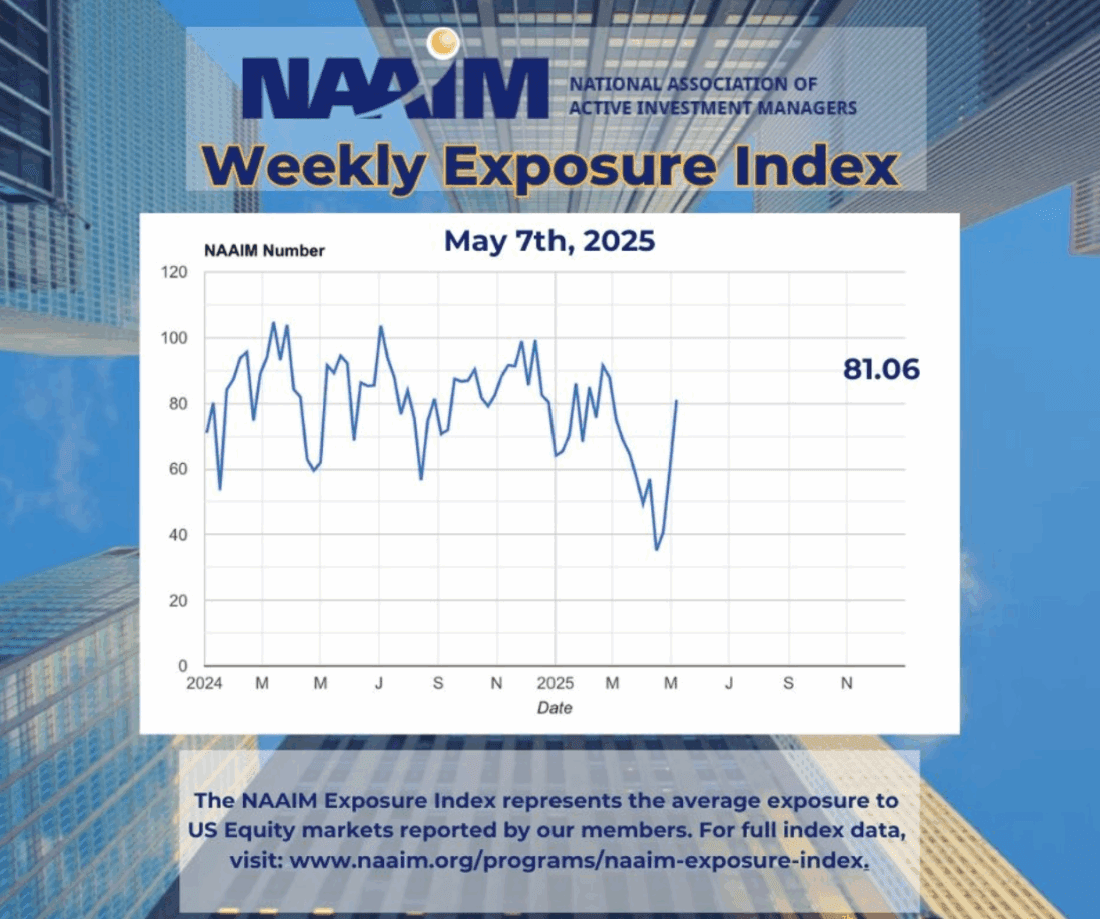
NAAIM Sentiment vs. Me
I’ve been a long-time contributor to the NAAIM Exposure Index and find it helpful to compare my view of the market to that of other financial professionals. It indicates to me how much relative conviction I have vs. other active managers in showing how much equity exposure is allocated to the market at a given time. It can also be helpful as a contrarian indicator in some instances.
Last week, the Exposure Index had a big rebound, back up above 80 – a typical reading for an up-trending market. Recently, this index has been lagging behind in catching up to the market rebound. But hey, don’t look at me; I’ve been reporting numbers just over 100 during the past couple of weeks, far exceeding the consensus of this community.
I also always appreciate Rob Hanna’s work (Quantifiable Edges), which shows that a NAAIM Index pullback into the 40 area can correspond to a short-term rebound rally over the following week or two. But again, it is not a signal, but a condition. Follow your setups and trade accordingly.
To sum up the situation going into this week: Seasonality suggests caution and the potential for a brief speed bump ahead. Most S&P 500 sectors seem to agree that this event could happen sometime this week. On the other hand, general sentiment does seem to be improving, and it’s good to see other managers finally catch up on this trend. I’m optimistic but cautious going into this week, as ultimately, the market still does whatever it wants.
Stay safe out there!
—
Originally posted 12th May 2025
Investopedia.com: The comments, opinions and analyses expressed herein are for informational purposes only and should not be considered individual investment advice or recommendations to invest in any security or to adopt any investment strategy. While we believe the information provided herein is reliable, we do not warrant its accuracy or completeness. The views and strategies described on our content may not be suitable for all investors. Because market and economic conditions are subject to rapid change, all comments, opinions and analyses contained within our content are rendered as of the date of the posting and may change without notice. The material is not intended as a complete analysis of every material fact regarding any country, region, market, industry, investment or strategy. This information is intended for US residents only.
Information posted on IBKR Campus that is provided by third-parties does NOT constitute a recommendation that you should contract for the services of that third party. Third-party participants who contribute to IBKR Campus are independent of Interactive Brokers and Interactive Brokers does not make any representations or warranties concerning the services offered, their past or future performance, or the accuracy of the information provided by the third party. Past performance is no guarantee of future results.
This material is from Investopedia and is being posted with its permission. The views expressed in this material are solely those of the author and/or Investopedia and Interactive Brokers is not endorsing or recommending any investment or trading discussed in the material. This material is not and should not be construed as an offer to buy or sell any security. It should not be construed as research or investment advice or a recommendation to buy, sell or hold any security or commodity. This material does not and is not intended to take into account the particular financial conditions, investment objectives or requirements of individual customers. Before acting on this material, you should consider whether it is suitable for your particular circumstances and, as necessary, seek professional advice.
Any discussion or mention of an ETF is not to be construed as recommendation, promotion or solicitation. All investors should review and consider associated investment risks, charges and expenses of the investment company or fund prior to investing. Before acting on this material, you should consider whether it is suitable for your particular circumstances and, as necessary, seek professional advice.
Municipal Bonds are only available from Interactive Brokers for IBKR LLC, IBKR Canada, IBKR Hong Kong, IBKR Australia and IBKR Singapore entities.
Related Articles


 News")


Join The Conversation
For specific platform feedback and suggestions, please submit it directly to our team using these instructions.
If you have an account-specific question or concern, please reach out to Client Services.
We encourage you to look through our FAQs before posting. Your question may already be covered!