
- Solve real problems with our hands-on interface
- Progress from basic puts and calls to advanced strategies
Interactive Options Course
Posted March 3, 2025 at 9:02 am
1/ BTC is Losing the Support
2/ Risk Appetite Continues to Decline
3/ Semiconductors Test Key Support
Investopedia is partnering with CMT Association on this newsletter. The contents of this newsletter are for informational and educational purposes only, however, and do not constitute investing advice. The guest authors, which may sell research to investors, and may trade or hold positions in securities mentioned herein do not represent the views of CMT Association or Investopedia. Please consult a financial advisor for investment recommendations and services.
BTC is Losing the Support
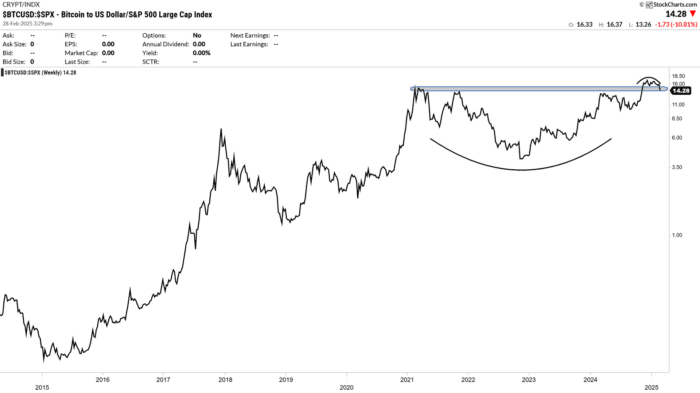
The BTC/SPX ratio measures the relationship between the price of Bitcoin (BTC) and the S&P 500 index (SPX), offering insight into the relative performance of the cryptocurrency compared to the U.S. stock market.
Both assets have experienced price declines; however, Bitcoin’s percentage drop has been slightly larger than that of the S&P 500 during this specific period. This suggests that, in relative terms, Bitcoin has shown slightly weaker resilience compared to the stock market on this particular day.
The recent volatility across financial markets can be attributed to various factors, including macroeconomic concerns and price movements in the cryptocurrency markets.

Courtesy of StockCharts.com
The ratio had managed to break above 14 points — a level it had remained below since 2021 — at the end of 2024, with expectations that the cryptocurrency would take off into a new super bullish rally. However, reality proved different, as the breakout was short-lived and the recent drop brings new concerns about how much further it could fall.
It has been observed that Bitcoin maintains a positive correlation with the Nasdaq/S&P 500 ratio (NDX/SPX) at least since 2017. This correlation suggests that when the technology sector outperforms the broader market, Bitcoin tends to show stronger relative performance as well. However, the opposite is also true — when the tech sector struggles, Bitcoin tends to underperform.
It’s no surprise, then, that the recent declines in the Nasdaq ($COMPQ) have been mirrored by similar declines in Bitcoin ($BTCUSD), with Bitcoin’s performance currently worse than the broader U.S. market.
A breakdown below 14 points in the ratio could extend the drop all the way to 7 points, which could trigger an even larger wave of liquidations. It’s crucial to closely monitor the performance of the technology sector to get a sense of where this recent decline might find some relief or stabilization.
Risk Appetite Continues to Decline
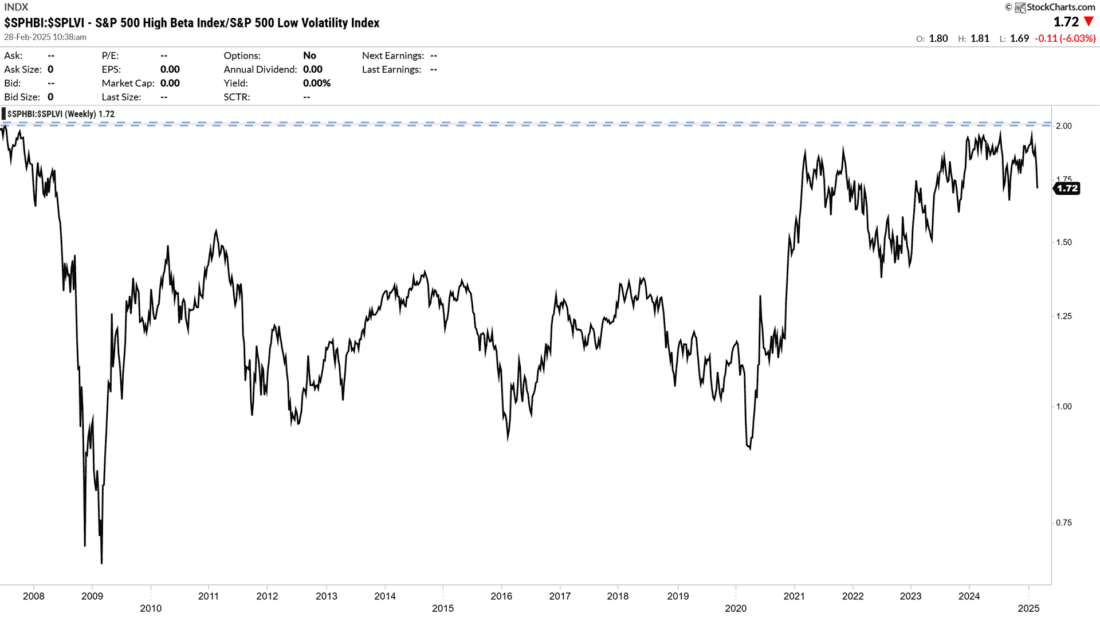
The analysis of the relationship between the S&P 500 High Beta Index and the S&P 500 Low Volatility Index provides insight into the market’s current preferences for higher-risk assets versus more stable ones.
Courtesy of StockCharts.com
A Ratio > 1 indicates that high beta assets (higher risk) are outperforming low volatility assets, which implies that investors have a greater appetite for risk. However, the trend throughout 2025 has been bearish, after the ratio nearly reached 2 points.
This level has become a clear and strong resistance zone, and after each approach to this area, we’ve seen an immediate reversal.
The bullish rally during 2024 also came to an end as the ratio approached this resistance, signaling a shift in investor sentiment towards a more risk-averse stance.
Semiconductors Test Key Support
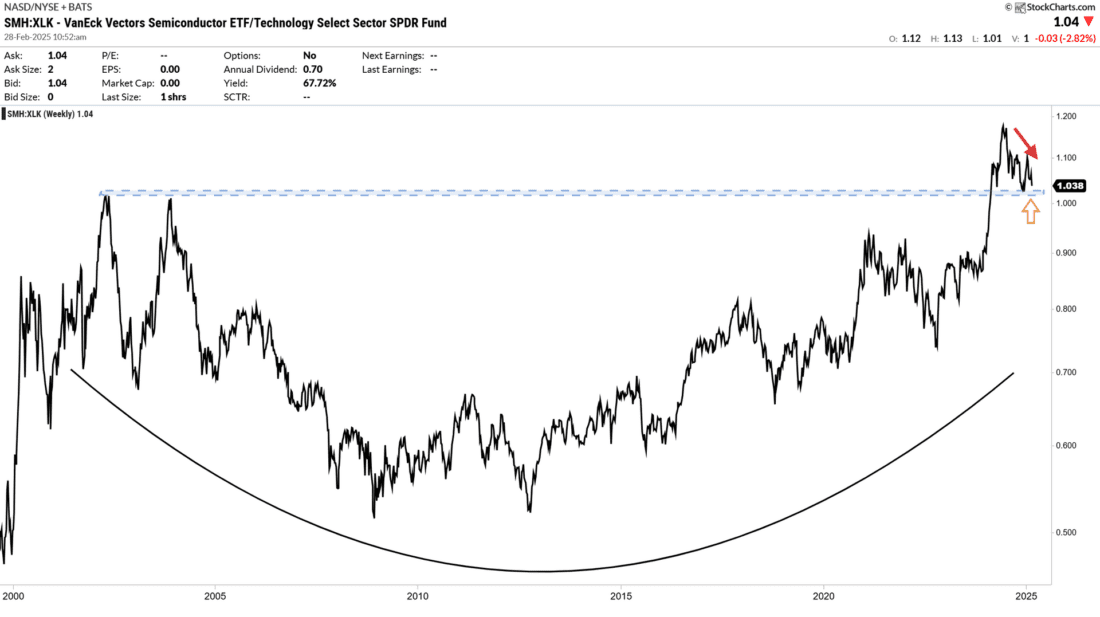
The analysis of the relationship between the VanEck Semiconductor ETF (SMH) and the Technology Select Sector SPDR ETF (XLK) provides insight into the relative performance of the semiconductor sector compared to the broader technology sector.
The VanEck Semiconductor ETF (SMH) offers investors a way to track the performance of U.S.-listed companies involved in semiconductor production. The fund’s top holdings include:
In total, the SMH index includes 25 securities.
On the other hand, XLK, with 66 securities, has a broader exposure to the technology sector. Its top holdings include:
Over the past decade, SMH has delivered an impressive cumulative return of 775.53%, while XLK has returned 535.34% over the same period. This demonstrates that, in the long run, the semiconductor sector has significantly outperformed the broader technology sector.
Currently, the SMH/XLK ratio is testing a key support level, which could determine whether semiconductors maintain their leadership within the technology space — or if a shift toward a broader, more diversified tech play is underway.
Courtesy of StockCharts.com
The semiconductor sub sector currently represents approximately 25% to 27% of the total weighting within the Technology Select Sector SPDR ETF (XLK).
The importance and weight of semiconductors within the technology sector is exceptionally high — and has grown significantly in recent years due to several key factors:
Semiconductors aren’t just another subsector within technology — they are the backbone supporting all future technological growth. That’s why we are watching so closely what could happen at this key level in the SMH/XLK ratio, and the implications a break below this support zone could have for the broader tech landscape.
—
Originally posted 28 February 2025
Investopedia.com: The comments, opinions and analyses expressed herein are for informational purposes only and should not be considered individual investment advice or recommendations to invest in any security or to adopt any investment strategy. While we believe the information provided herein is reliable, we do not warrant its accuracy or completeness. The views and strategies described on our content may not be suitable for all investors. Because market and economic conditions are subject to rapid change, all comments, opinions and analyses contained within our content are rendered as of the date of the posting and may change without notice. The material is not intended as a complete analysis of every material fact regarding any country, region, market, industry, investment or strategy. This information is intended for US residents only.
Information posted on IBKR Campus that is provided by third-parties does NOT constitute a recommendation that you should contract for the services of that third party. Third-party participants who contribute to IBKR Campus are independent of Interactive Brokers and Interactive Brokers does not make any representations or warranties concerning the services offered, their past or future performance, or the accuracy of the information provided by the third party. Past performance is no guarantee of future results.
This material is from Investopedia and is being posted with its permission. The views expressed in this material are solely those of the author and/or Investopedia and Interactive Brokers is not endorsing or recommending any investment or trading discussed in the material. This material is not and should not be construed as an offer to buy or sell any security. It should not be construed as research or investment advice or a recommendation to buy, sell or hold any security or commodity. This material does not and is not intended to take into account the particular financial conditions, investment objectives or requirements of individual customers. Before acting on this material, you should consider whether it is suitable for your particular circumstances and, as necessary, seek professional advice.
Any discussion or mention of an ETF is not to be construed as recommendation, promotion or solicitation. All investors should review and consider associated investment risks, charges and expenses of the investment company or fund prior to investing. Before acting on this material, you should consider whether it is suitable for your particular circumstances and, as necessary, seek professional advice.
Cryptocurrency based Exchange Traded Products (ETPs) are high risk and speculative. Cryptocurrency ETPs are not suitable for all investors. You may lose your entire investment. For more information please view the RISK DISCLOSURE REGARDING COMPLEX OR LEVERAGED EXCHANGE TRADED PRODUCTS.
There is a substantial risk of loss in foreign exchange trading. The settlement date of foreign exchange trades can vary due to time zone differences and bank holidays. When trading across foreign exchange markets, this may necessitate borrowing funds to settle foreign exchange trades. The interest rate on borrowed funds must be considered when computing the cost of trades across multiple markets.
Spot currencies are not available at IBKR Singapore.
Related Articles


Join The Conversation
For specific platform feedback and suggestions, please submit it directly to our team using these instructions.
If you have an account-specific question or concern, please reach out to Client Services.
We encourage you to look through our FAQs before posting. Your question may already be covered!